Chart. Analyse. Trade.
Tailor your charts, track live prices, and make your move — all with the in-depth analysis that TradingView provides. Whether it’s Forex, Stocks, or 24/7 Derived Indices, you’ve got the insights at your fingertips.
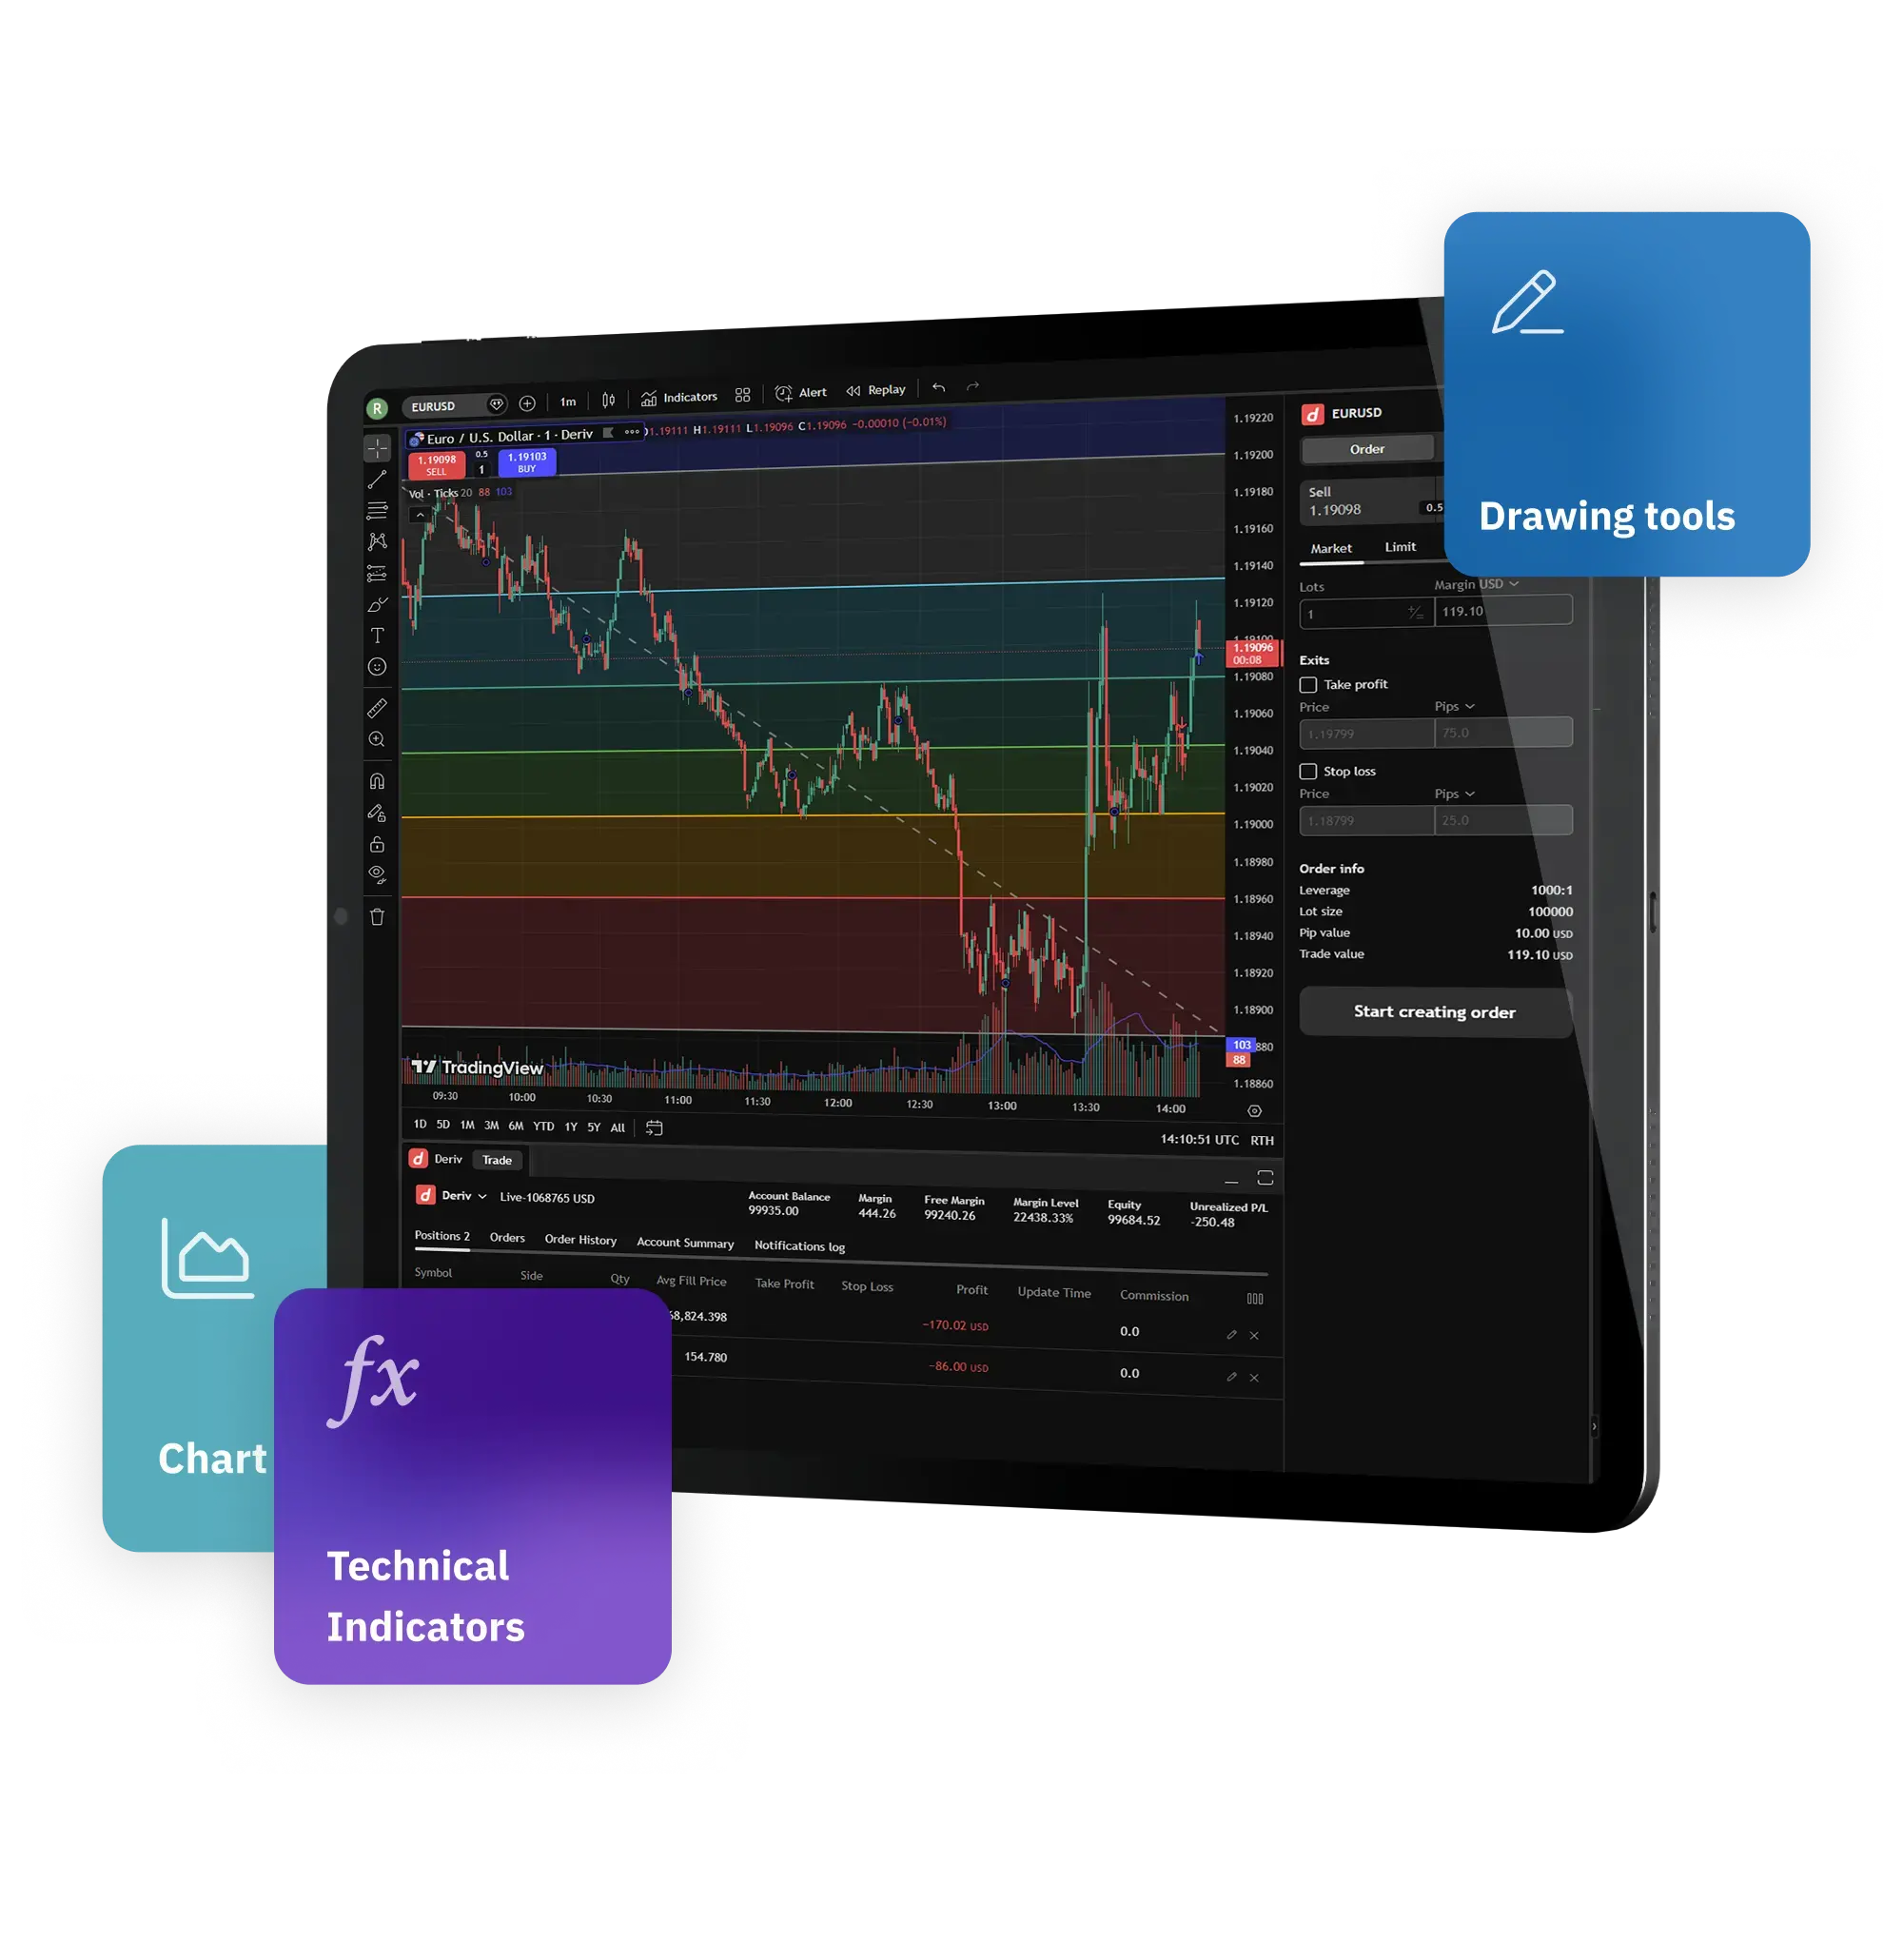
100+ indicators for detailed analysis
Whether it’s moving averages, volatility studies, or custom-built indicators, dig deep and craft well-informed trading strategies.
Real-time alerts that keep you ahead
Set custom price, indicator, or trendline alerts and get notified the moment the market moves your way.
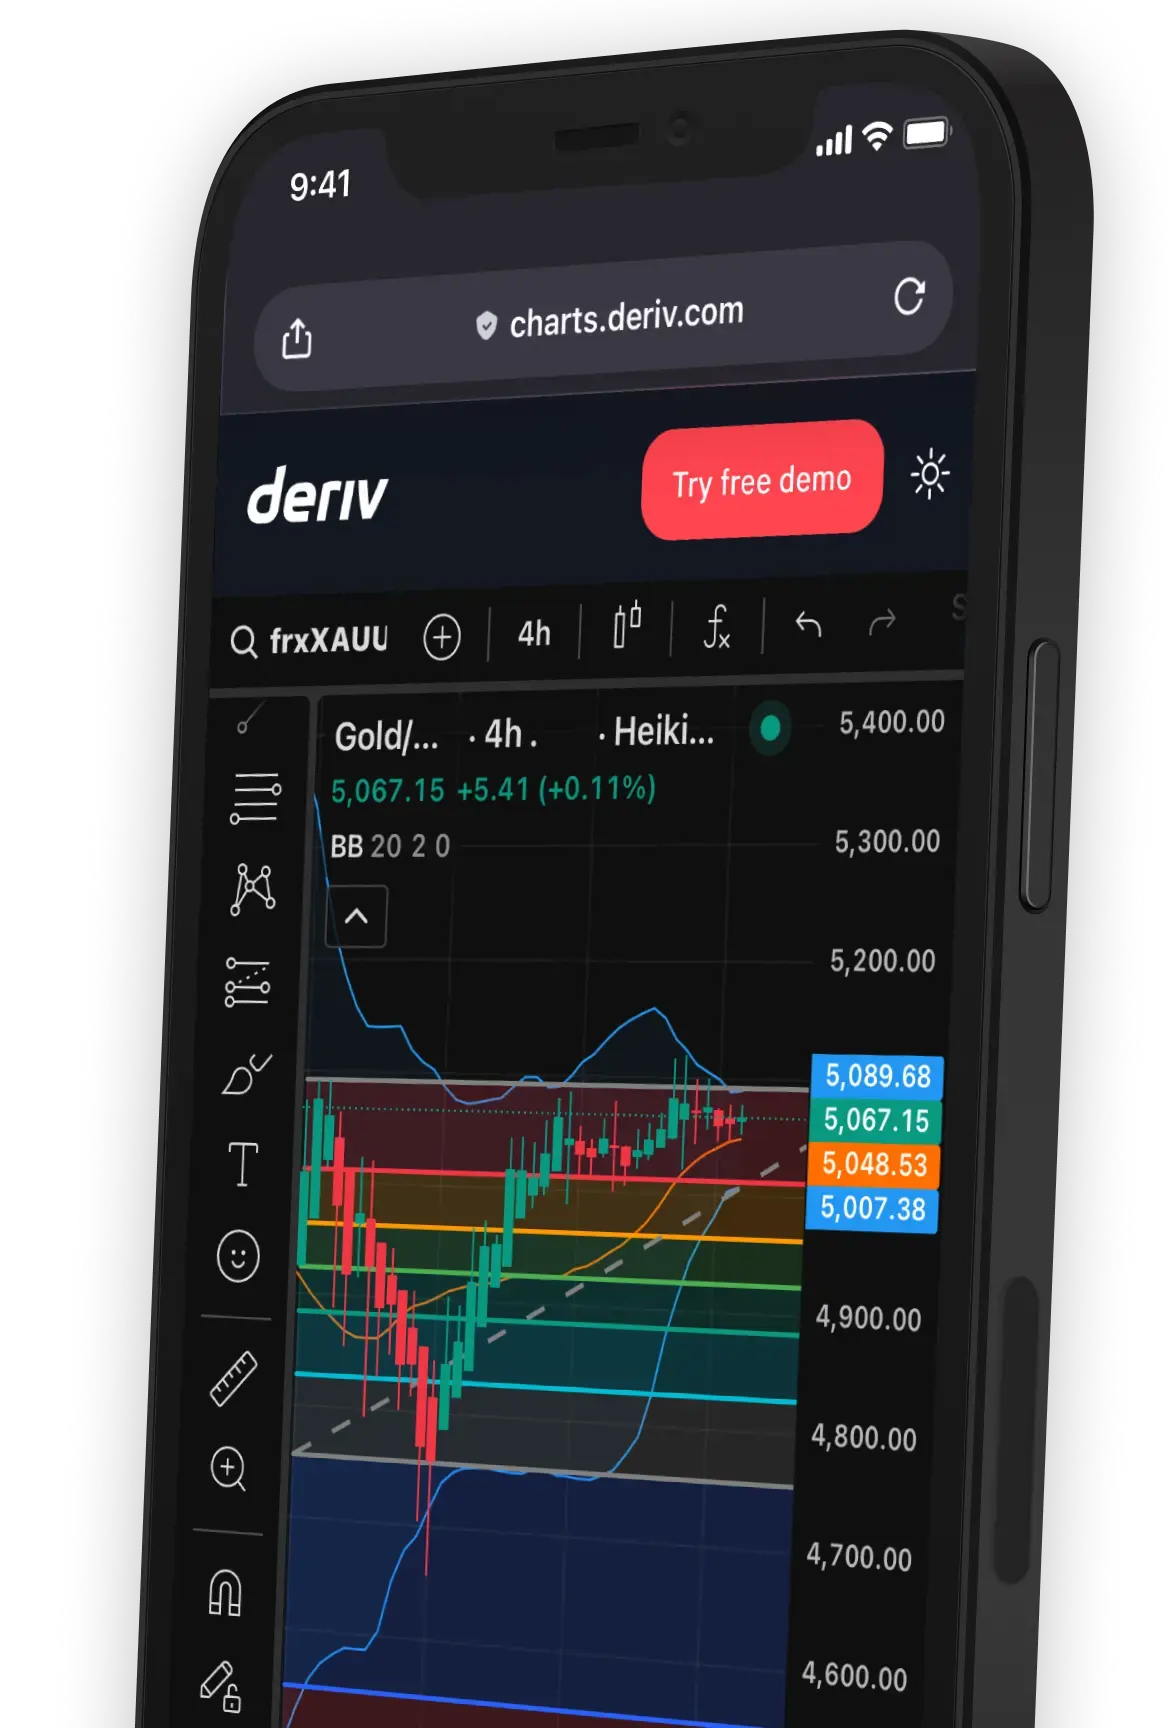
See the market your way
Adapt your perspective to match your strategy. From candlesticks to Renko to Kagi, explore 17 different chart types that let you visualise the market from every angle.
Trade directly from the charts
Spot an opportunity and act instantly. Place, modify, and manage your trades directly on TradingView charts without switching platforms.
Available on