Can the Bitcoin bull run retain the spotlight with Ethereum heating up?

Until recently, the story was simple: Bitcoin was in charge. ETF approvals had kicked off a wave of institutional demand, the halving had trimmed supply, and the market seemed happy to crown BTC the leader of this bull cycle.
Then Ethereum crashed the party.
After drifting quietly in the background for months, ETH suddenly came to life. It didn’t just rise - it surged.
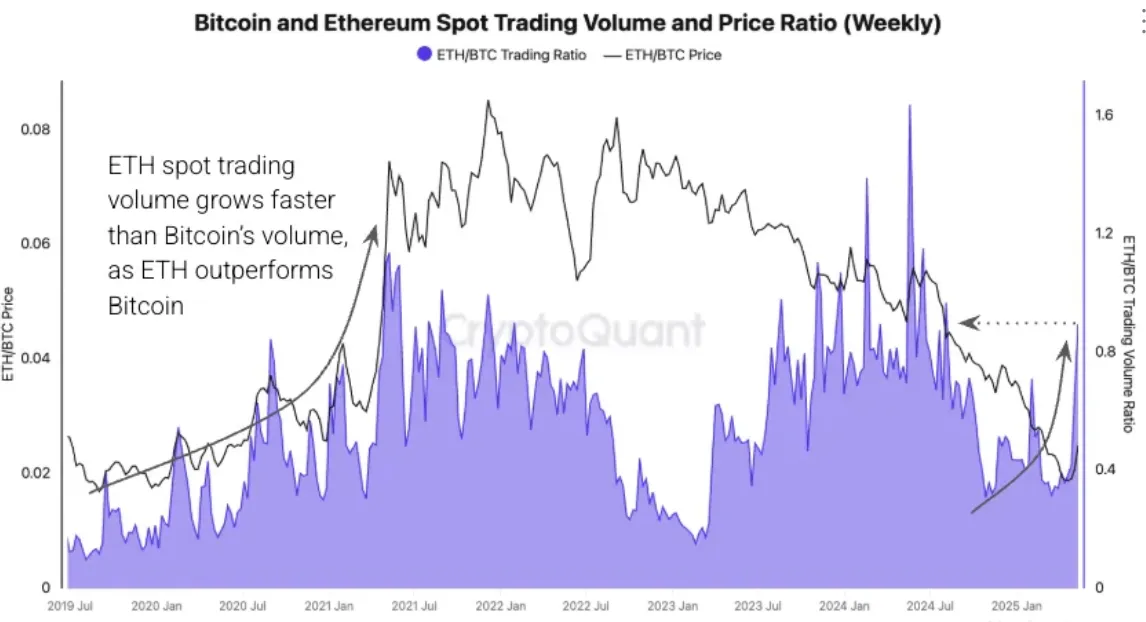
The ETH/BTC ratio spiked 38% in a week, the strongest reversal in years. That move wasn’t driven by noise; it was backed by solid metrics and growing market confidence. Trading volumes climbed, on-chain indicators flipped bullish, and institutional portfolios began shifting.
Just like that, the clean Bitcoin narrative got a lot messier.
The perfect market conditions
Bitcoin had everything going for it. The market had just digested one of the most anticipated events in crypto - spot ETF approval in the US - bringing a wave of institutional credibility. The halving followed soon after, setting the stage for a classic post-supply-shock rally. Add in geopolitical uncertainty and central bank wobbles, and Bitcoin looked primed to shine as digital gold.
And it was. Until Ethereum stirred the pot.
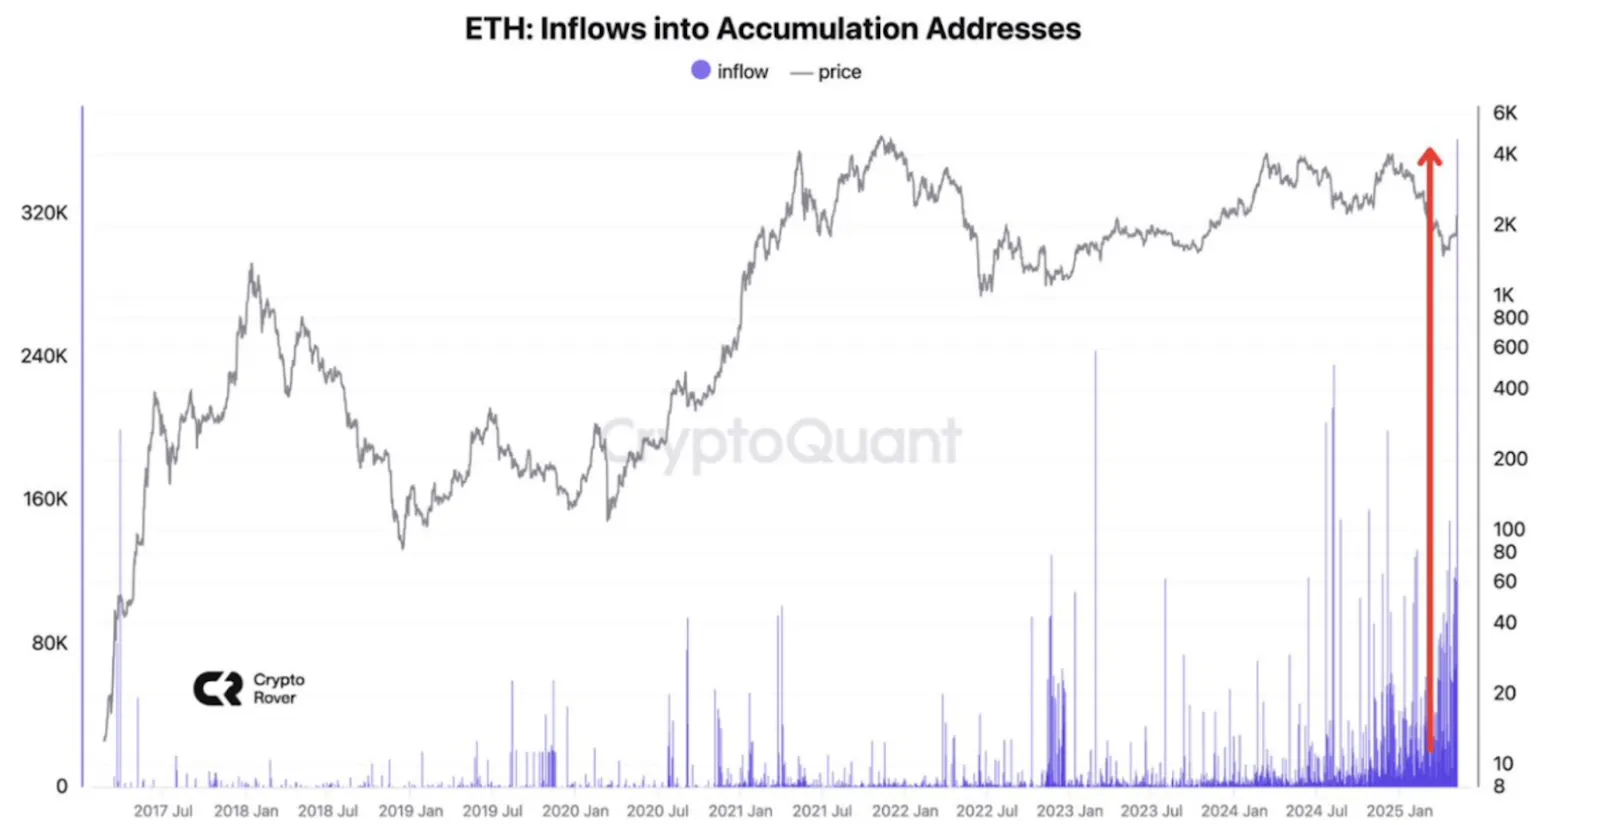
ETH’s breakout wasn’t just about price. On-chain, things began to shift. Exchange inflows, a proxy for sell pressure, dropped to their lowest levels since 2020, suggesting holders weren’t eager to cash out. Meanwhile, Ethereum ETF holdings quietly climbed, hinting at a subtle but growing wave of institutional interest.
ETH/BTC ratio
What stood out most, though, was the ETH/BTC valuation metric, which had dipped into extreme undervaluation territory for the first time since 2019.
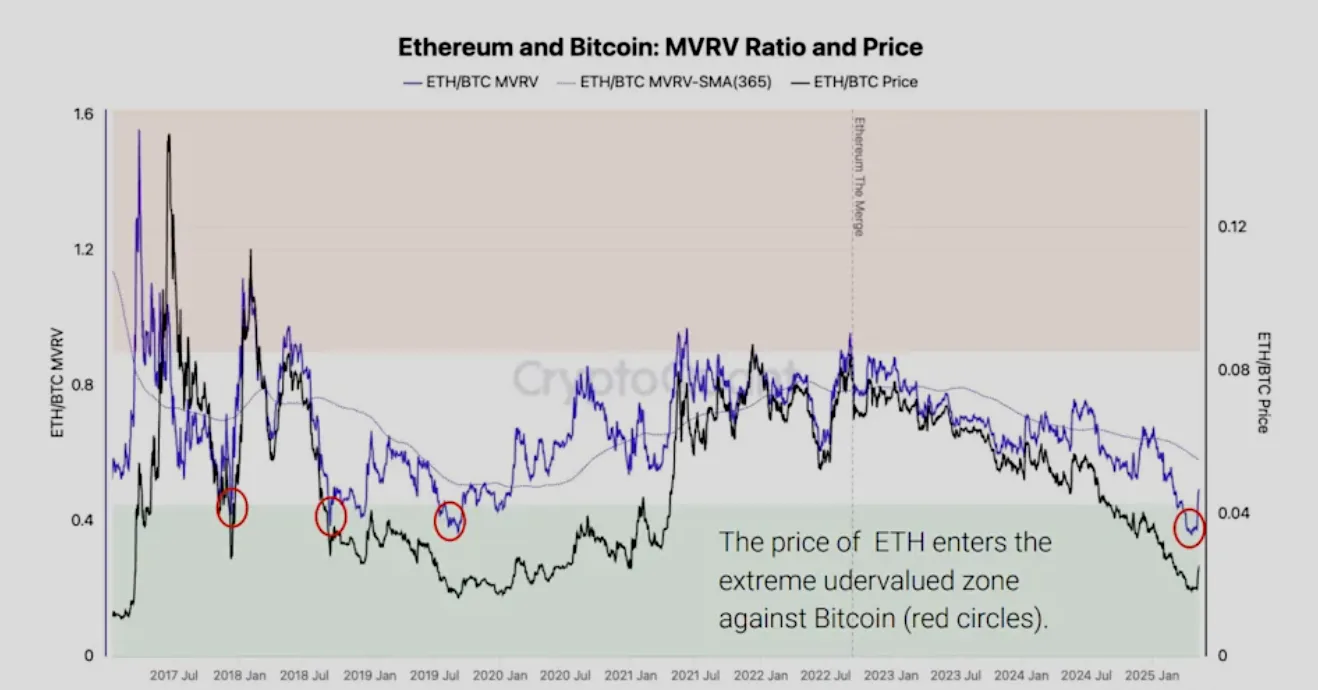
Historically, those levels have preceded periods of ETH outperformance. This time, it looks like history might be repeating.
ETH is no longer just along for the ride. It’s starting to steer its own narrative.
Bitcoin still leads - but it’s not alone
This doesn’t mean Bitcoin is losing ground - far from it. It’s still trading near highs, and its role as the anchor of the crypto market remains intact. But Ethereum’s comeback has introduced something BTC hasn’t had to deal with in a while: shared attention.
What was shaping up to be a textbook Bitcoin-led bull run has suddenly turned into a two-horse race. And that changes the dynamic - not in a negative way, but in a way that forces investors to think beyond a single asset thesis.
The market is no longer just banking on Bitcoin. It’s banking on crypto.
Bitcoin outlook: What’s next?
With both BTC and ETH pulling back slightly, it’s tempting to focus on short-term noise. But zoom out, and it’s clear that Ethereum’s momentum is more than a fluke. The capital rotation, the volume shift, the fundamental support - it all points to a market that’s broadening, not breaking.
Bitcoin remains the foundation, but Ethereum is emerging as the growth story within the same cycle. One is the anchor, and the other, the accelerator.
And that’s what makes this bull run so fascinating. It’s no longer just about how high Bitcoin can go - it’s about who else is coming with it.
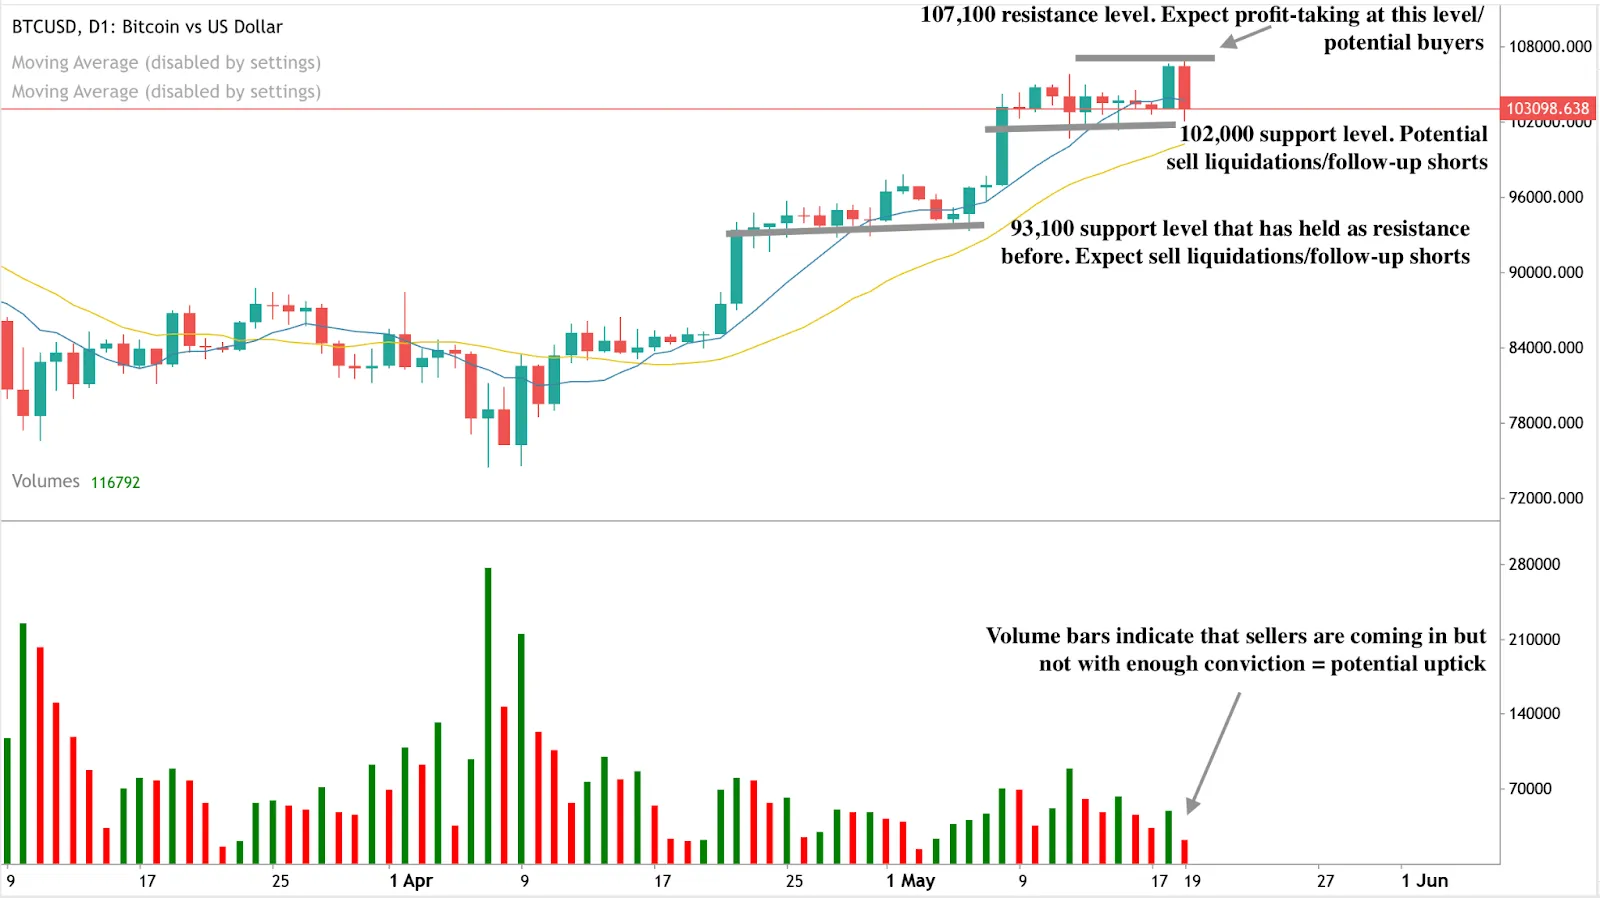
At the time of writing, BTC is retreating and currently touching a significant support level. Though sell-side bias is currently evident on the daily chart, the volume bars indicate that sell-side pressure is waning and the rally may resume.
If we see a bounce from the current support level, the price could encounter a resistance wall at the $107,100 level. On the contrary, if the slump continues past the support level, the price could find support floors at the $102,000 and $93,100 price levels.
Is ETH set for a huge bounce? You can speculate on the price of BTC and ETH with a Deriv MT5 or Deriv X account.
Disclaimer:
The performance figures quoted are not a guarantee of future performance.
The information contained within this blog article is for educational purposes only and is not intended as financial or investment advice. The information may become outdated. We recommend you do your own research before making any trading decisions.


