The liquidity paradox: Why Bitcoin is cooling under $110K in November

Bitcoin’s cooling near $110,000 in November marks a puzzling moment for traders and analysts. Global liquidity is expanding again as central banks ease policy to counter slowing growth, yet Bitcoin - historically the first responder to looser money - remains flat. With ETF outflows rising, institutional demand softening, and the Federal Reserve’s hawkish tone weighing on sentiment, Bitcoin’s price action now reflects a market caught between the need for monetary expansion and investor hesitation.
Key takeaways
- Bitcoin hovers near $110K, consolidating after Uptober’s rally amid ETF outflows of nearly $700M.
- Global M2 money supply has expanded 8% in 2025, led by liquidity injections from the U.S., China, and Europe.
- Despite two rate cuts, the Federal Reserve’s hawkish outlook has muted market confidence.
- Over $8B in short positions could be liquidated if Bitcoin breaks above $117K, marking a potential bullish reversal.
- The broader liquidity uptrend remains intact, supporting Bitcoin’s long-term growth trajectory.
Bitcoin ETF outflows signal institutional caution
Bitcoin ETFs recorded $470.7 million in net outflows, with FBTC and ARKB driving the bulk of redemptions. Meanwhile, Ethereum ETFs also saw notable losses, shedding $81.44 million over the same period. That retreat follows a multi-month streak of inflows that previously drove Bitcoin’s climb toward $124K in mid-August.
According to Glassnode, the trend highlights “rising sell pressure from TradFi investors and renewed weakness in institutional demand.” This suggests that large funds, which helped propel the earlier rally, are now paring back exposure in anticipation of tighter liquidity or year-end portfolio rebalancing.
The timing is notable - ETF withdrawals occurred immediately after the Federal Reserve’s second consecutive rate cut, which was widely expected to spark a broader risk rally. Instead, the Fed’s hawkish tone for December dampened enthusiasm. Institutional traders appear to be interpreting the cuts not as a pivot, but as a precautionary move amid economic weakness.
Rate cuts without confidence: The Fed’s hawkish paradox
Bitcoin’s subdued performance underscores a deeper policy contradiction. The Federal Reserve has reduced interest rates twice in the past quarter, unwinding some of its pandemic-era tightening. Yet, Chair Jerome Powell’s warning against “assuming further cuts” signalled caution, not stimulus.
This hawkish easing has left markets in limbo - rate cuts suggest policy support, but the language surrounding them implies the Fed is not fully confident in economic momentum. As a result, risk assets such as Bitcoin have struggled to attract sustained buying interest.
Friday’s Wall Street session clearly showed this hesitation. Despite easing conditions, equities softened and Bitcoin slipped below $106,500, reflecting cross-asset caution. A brief weekend rebound to $111,500 quickly met resistance, reinforcing the sense that traders are waiting for a stronger macro signal before re-entering in size.
Global money supply expansion: Bullish backdrop-delayed Impact
Behind the short-term turbulence, the macro environment is increasingly supportive of Bitcoin’s long-term outlook. Central banks across major economies have quietly restarted liquidity expansion - reversing much of the monetary tightening imposed between 2022 and 2023.
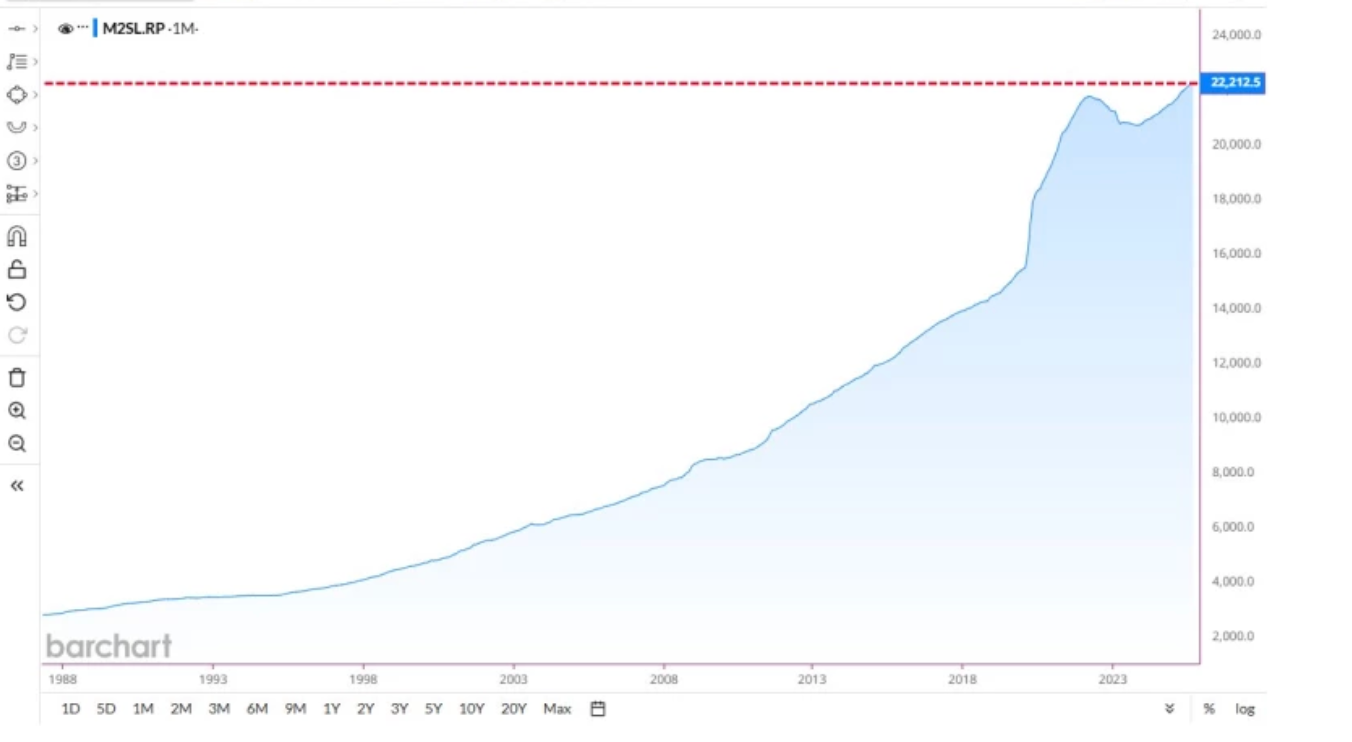
- United States: M2 money supply has grown 5% year-over-year, surpassing its April 2022 high, signalling an end to quantitative tightening.
- China: Facing deflationary pressures and youth unemployment, China saw an M2 growth rate of 8.5% in September.
- Japan: The Bank of Japan remains committed to ultra-loose policy, as the yen continues to weaken under low rates.
Overall, global M2 growth is expected to stand at around 8% in 2025 - a historically strong level of liquidity creation. In previous cycles, such expansions have correlated with sharp Bitcoin rallies, albeit with a lag of several months.
If you’re monitoring these trends, you can track Bitcoin’s real-time price movements and liquidity-sensitive assets on Deriv MT5.
Liquidity and lag: Why Bitcoin hasn’t reacted yet
Bitcoin’s muted reaction may simply reflect timing, not weakness. Historically, liquidity expansion first fuels traditional risk assets - equities, bonds, and corporate credit - before shifting into high-beta instruments like Bitcoin.
This pattern has held in multiple cycles:
- Following the COVID-19 stimulus in 2020, Bitcoin lagged behind equity inflows by roughly four months before surging past $ 60,000.
- During the 2021 tightening-to-easing pivot, Bitcoin followed global M2 growth only after stock market valuations had stabilised.
In 2025, the same dynamic appears to be unfolding. Liquidity is increasing, but institutional portfolios are still adjusting to macro uncertainty. Bitcoin’s next move likely depends on when, not whether, that liquidity filters into the crypto market.
Elon Musk and the debt spiral narrative
Adding to the macro backdrop, Elon Musk has reignited the debate about U.S. debt sustainability. With national debt now at $38 trillion, and interest payments exceeding the U.S. military budget, Musk warns that the country is “hurtling toward bankruptcy.”
Speaking on The Joe Rogan Experience, he argued that only rapid advances in AI and robotics could expand productivity fast enough to offset spiralling debt costs. He also called fiat currencies “hopeless” - a sentiment that resonates with Bitcoin’s founding ethos.
This rhetoric reinforces Bitcoin’s role as a hedge against systemic fragility. While Musk’s commentary may not directly move markets, it underscores why liquidity growth - a symptom of debt reliance - remains an underlying driver of crypto’s long-term appeal.
Bitcoin technical analysis: Consolidation with uptrend intact
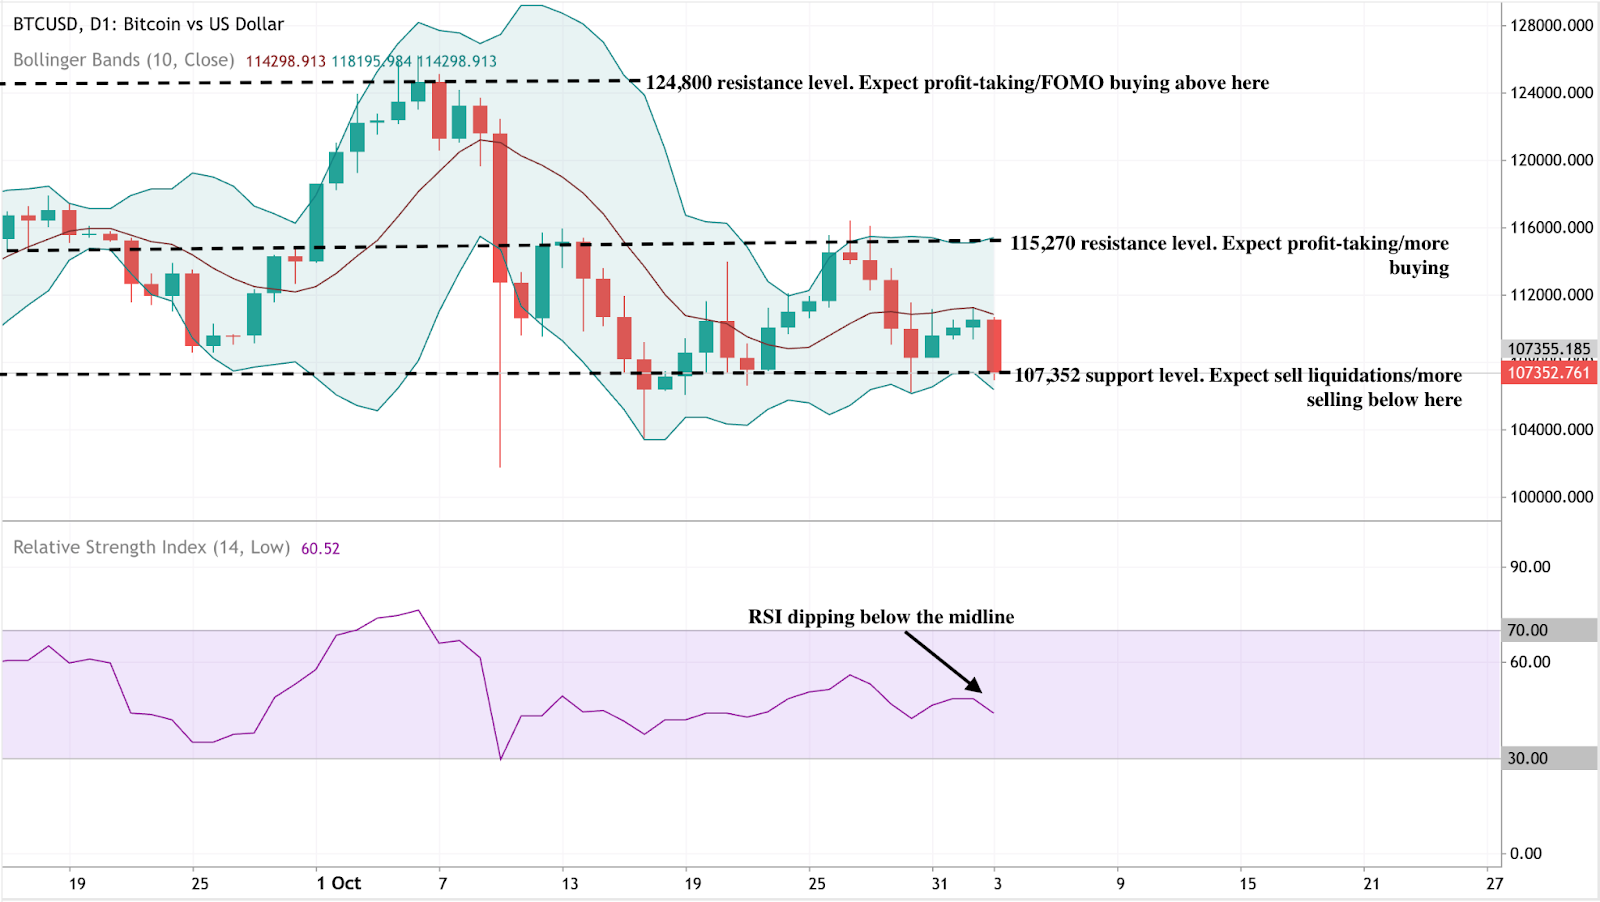
Bitcoin’s daily chart displays a cautious tone as the price hovers near $107,352, a key support zone that has remained firm throughout October. A decisive break below this level could trigger sell liquidations and further downside pressure, especially with the RSI dipping below the midline (50) - a signal that bearish momentum is building.
The Bollinger Bands (10, close) have narrowed, indicating a potential decline in volatility and a possible breakout in volatility ahead. If bears manage to push BTC below the lower band, a slide toward the $106K–$102K range can’t be ruled out.
On the upside, bulls face stiff resistance at $115,270 and $124,800. These levels have historically triggered profit-taking and FOMO buying, suggesting that any short-term rebound could face selling pressure. A clear daily close above $115K would be the first sign that bullish sentiment is regaining traction.
Analyst Ali Martinez points out that Bitcoin’s broader structure is still bullish - characterised by higher highs and higher lows since its 2022 bottom. Historical drawdowns of 50%–70% in prior cycles have already played out, suggesting that the market’s “worst phase may be behind it.”
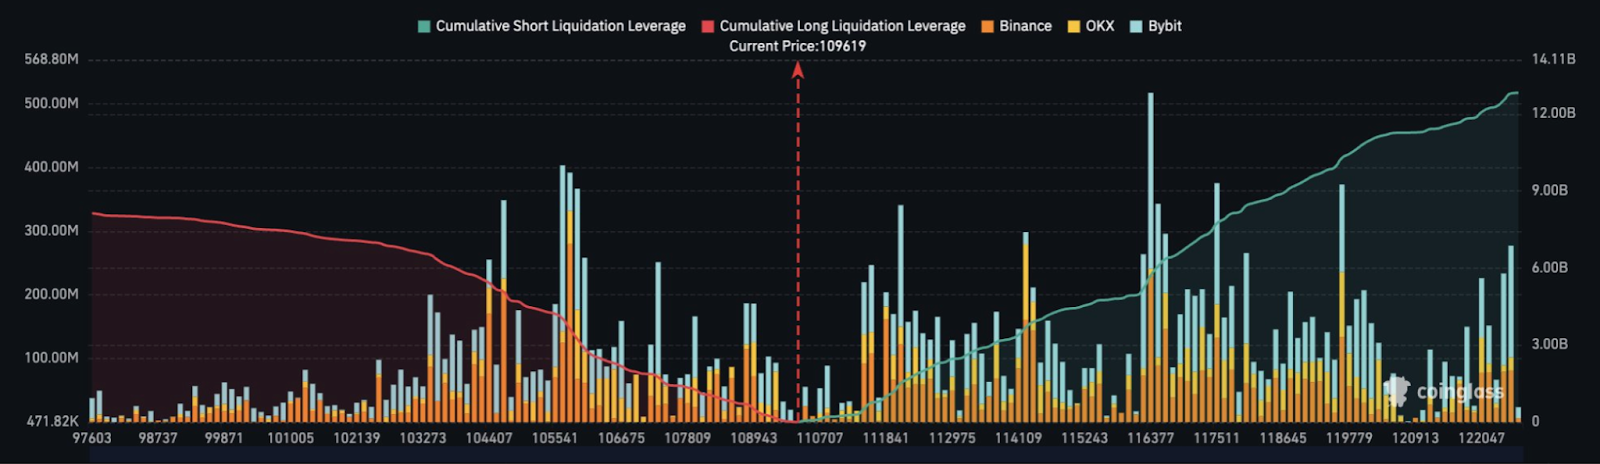
If Bitcoin clears $117K, over $8 billion in short positions could be liquidated, potentially igniting a sharp upside breakout.
You can use Deriv’s trading calculator to estimate your margin, pip, and profit levels while tracking Bitcoin’s next move
Breakout or breakdown: What defines the next phase
The next few weeks could determine whether Bitcoin’s cooling is a healthy reset or the first sign of weakness in the bull run.
- Bullish case:
Liquidity expansion continues, ETF outflows stabilise, and Bitcoin breaks $117K - unleashing a wave of short covering and renewed institutional demand. - Bearish case:
Fed communication remains hawkish, TradFi investors maintain risk aversion, and Bitcoin tests support around $100K–$102K before stabilising.
December’s Federal Reserve meeting may serve as the key trigger for direction - and could set the tone for Bitcoin’s performance through 2026.
Bitcoin Investment implications November 2025
For active traders, Bitcoin’s current consolidation offers tactical opportunities near $105K–$110K support zones. However, volatility remains tied to macro headlines, especially upcoming Fed communications and liquidity data.
For longer-term investors, the takeaway is clearer: global liquidity is increasing, debt remains unsustainable, and central banks continue to prioritise growth over austerity. In this environment, Bitcoin’s cooling may represent a delayed, not denied, response - positioning it as one of the few assets likely to benefit once liquidity fully transmits into markets.
The performance figures quoted are not a guarantee of future performance. The future performance figures quoted are only estimates and may not be a reliable indicator of future performance.


