Byczy rajd Chainlink może podtrzymać wzrost w kierunku 25 USD
Uwaga: Od sierpnia 2025 roku nie oferujemy już platformy Deriv X.
Chainlink ostatnio przyciąga uwagę – nie tylko swoim ruchem cenowym, ale także prawdziwymi oznakami momentum wykraczającymi poza zwykłe rozmowy o kryptowalutach. Po pewnym odbiciu od poziomu 15 USD, LINK pnie się w górę na wykresach i flirtuje z kluczowymi poziomami oporu.
Popyt na rynku spot jest silny, traderzy instrumentów pochodnych masowo angażują się, a szum wokół rzeczywistej adopcji tylko dolewa oliwy do ognia. Ale czy ten rajd jest trwały, czy to kolejny przesadzony sprint zmierzający do potknięcia?
Kupujący znów przejmują kontrolę
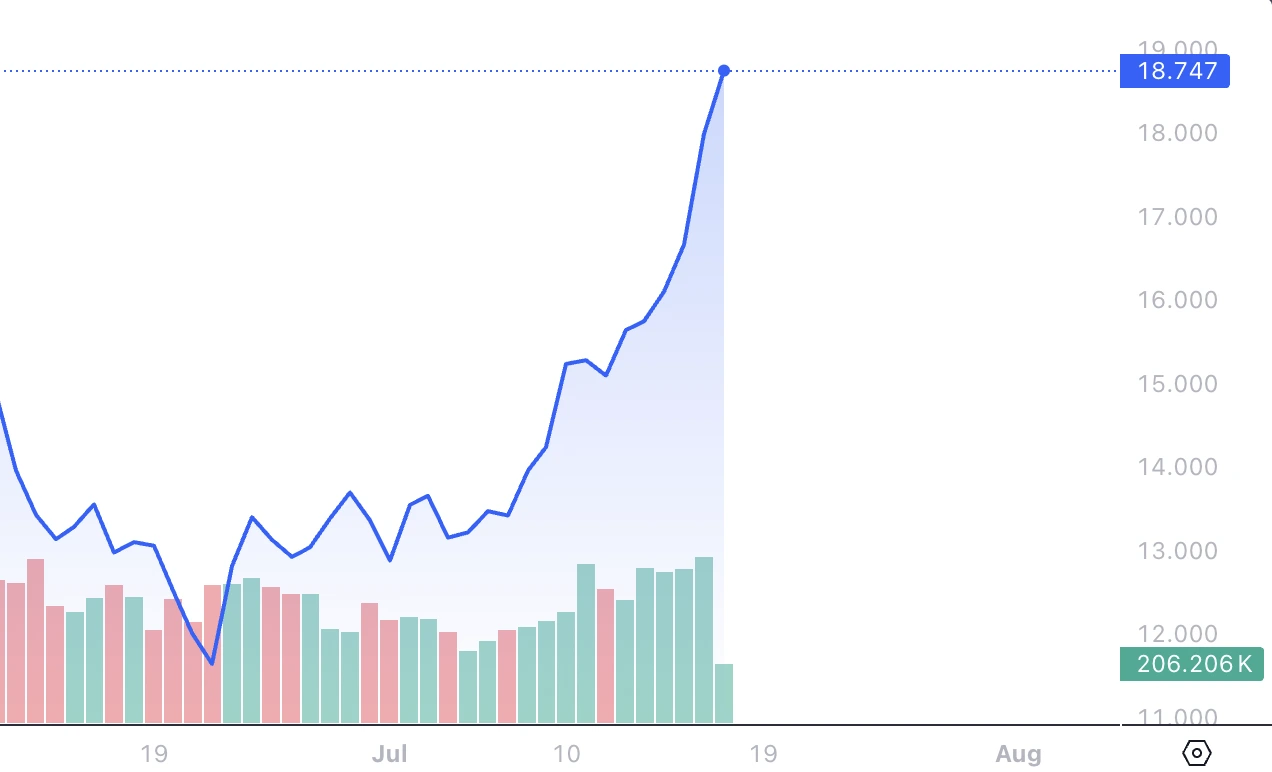
Zacznijmy od tego, co napędza ekscytację: Analitycy twierdzą, że wykres Chainlink wygląda niepodważalnie byczo. Od początku lipca tworzy solidny trend wzrostowy z wyższymi szczytami i wyższymi dołkami – klasyczna struktura sygnalizująca siłę. Po utrzymaniu się blisko poziomu wsparcia 15,20 USD, LINK systematycznie rośnie z jedynie drobnymi korektami, z każdą z nich spotykając się z odnowionym entuzjazmem kupujących.
Takie momentum to nie tylko szum cenowy – stoi za nim prawdziwa przekonanie. Wolumen kupna Spot Taker pokazuje, że agresywni kupujący konsekwentnie przewyższali sprzedających przez ostatnie 90 dni.
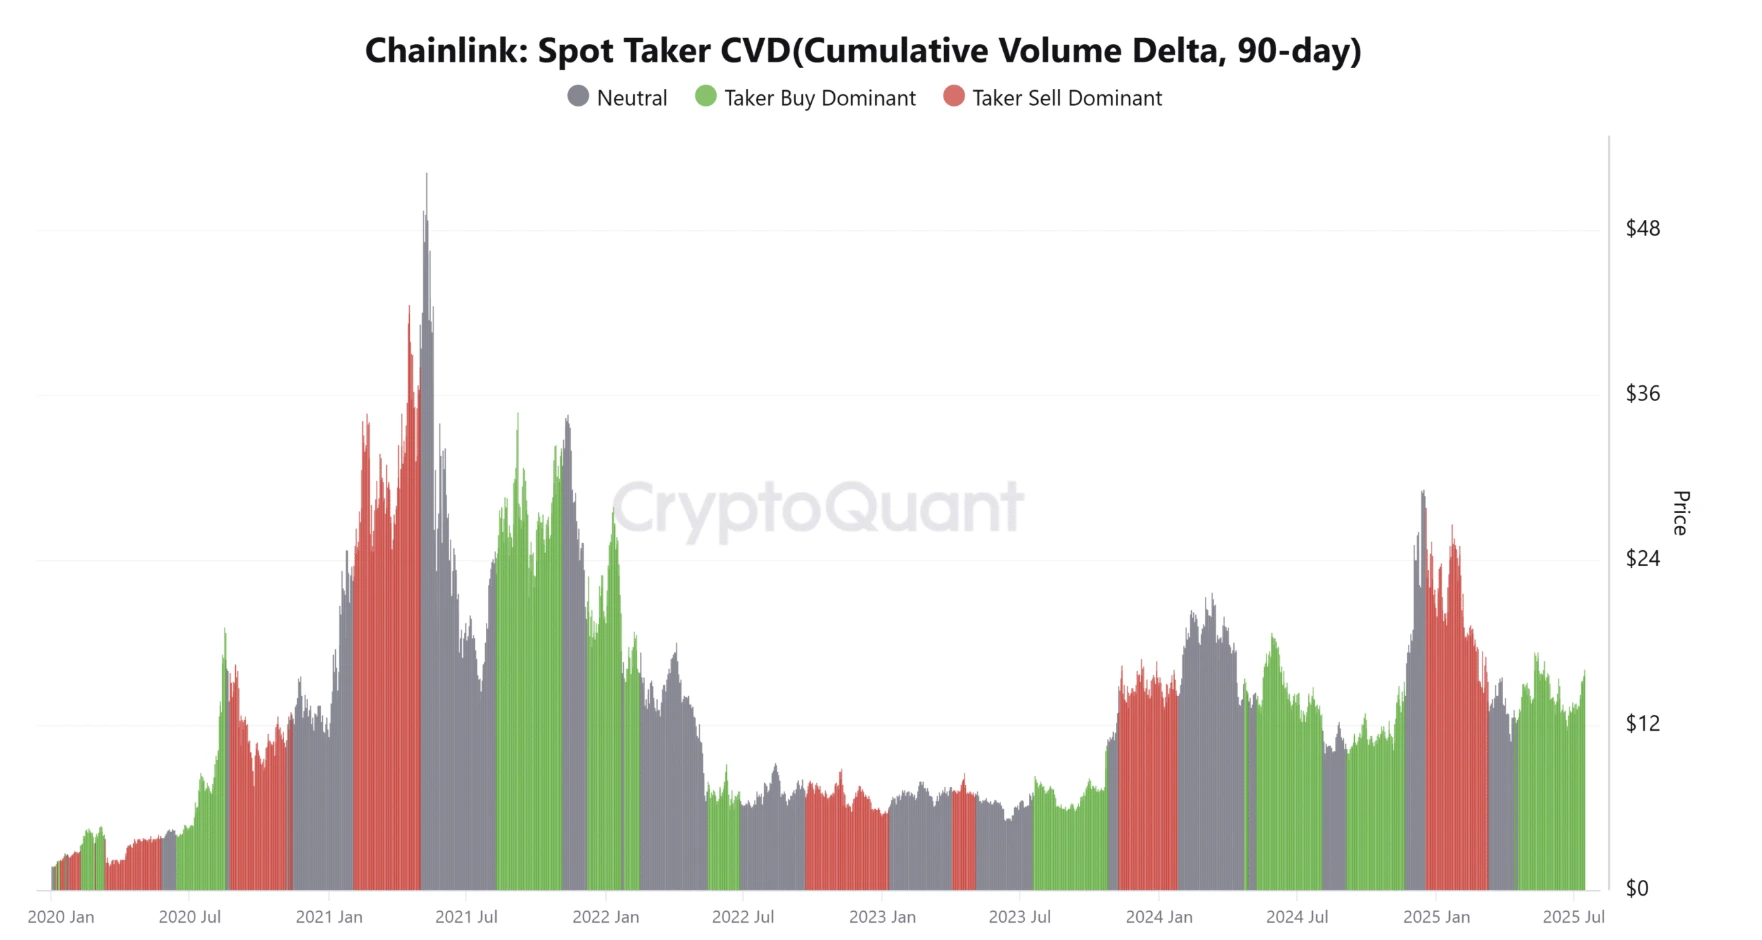
Wielu twierdzi, że to nie przypadek – to sygnał, że byki kontrolują rynek, przynajmniej na razie. Dodatkowo, wolumen obrotu niedawno przekroczył 659 milionów dolarów w ciągu jednego dnia. To nie jest powietrze, według analityków. To prawdziwa aktywność rynkowa, sugerująca, że wzrost ceny LINK nie dzieje się w próżni – jest udział, płynność i rzeczywiste zainteresowanie na tym poziomie.
Dane z rynku instrumentów pochodnych pokazują mieszany obraz
Po stronie futures i opcji sytuacja się rozgrzewa – ale być może zbyt mocno. Stopy finansowania wróciły do dodatniego terytorium po tygodniach na minusie.
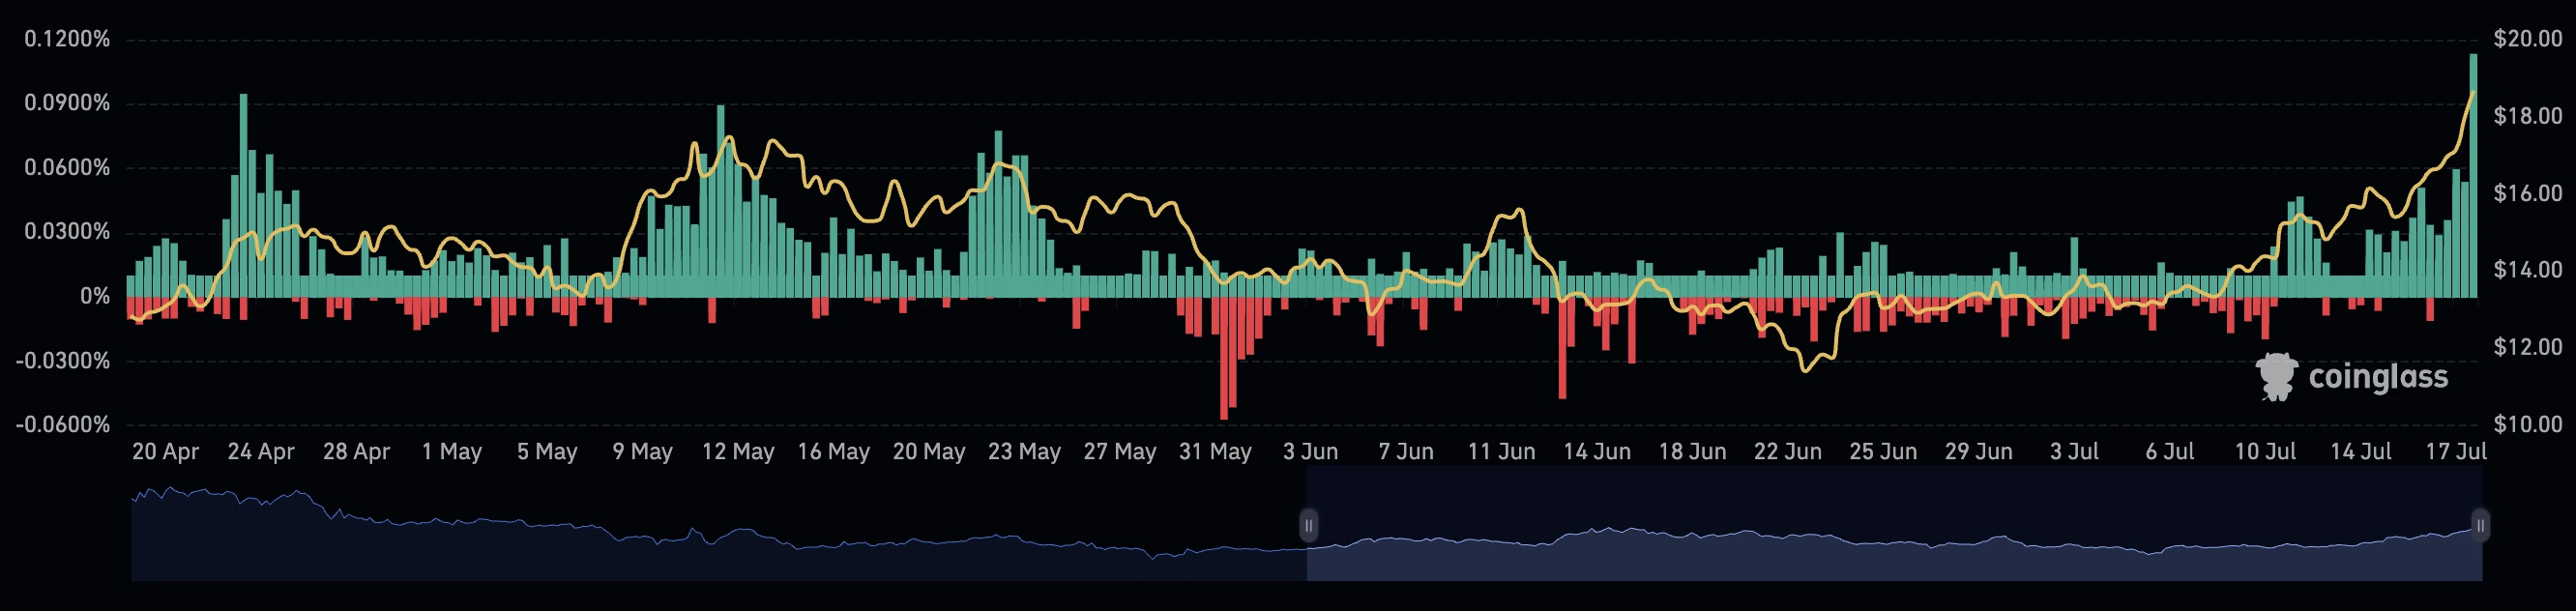
Mówiąc prosto, traderzy są teraz gotowi zapłacić premię za utrzymanie pozycji długich. To zwykle oznaka zaufania – bycza grupa, chętna postawić pieniądze tam, gdzie ma usta.
Otwarte pozycje również wzrosły o 8,47% w ciągu 24 godzin, osiągając imponujące 843 miliony dolarów.
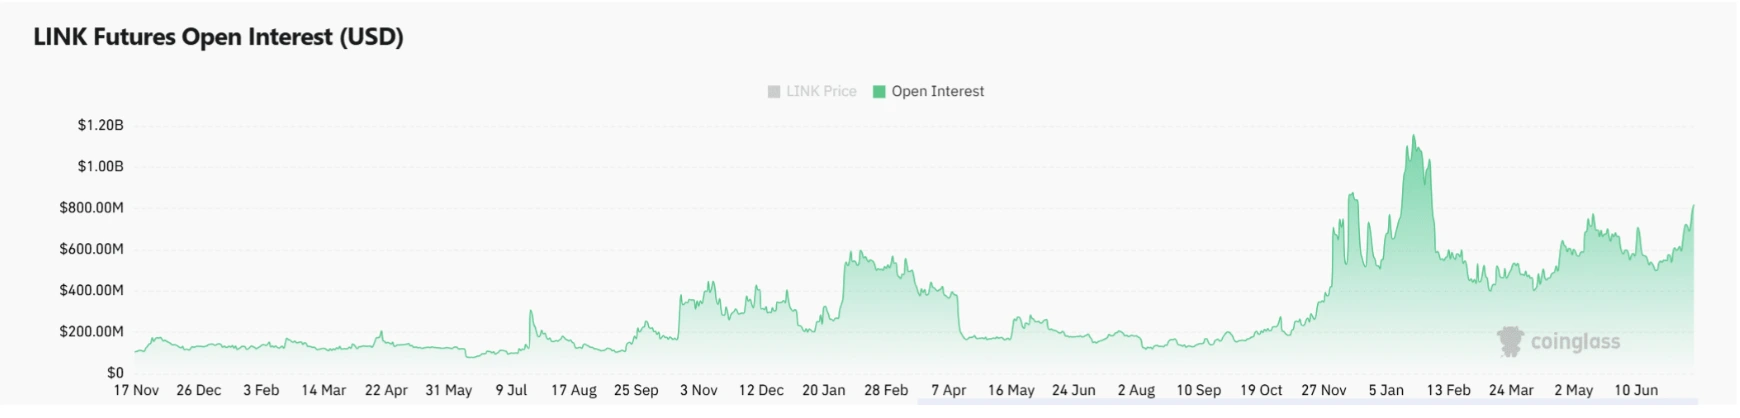
Ten wzrost pokazuje wyraźny wzrost aktywności spekulacyjnej. Ale jest haczyk: gdy otwarte pozycje rosną tak gwałtownie w pobliżu kluczowego oporu, często oznacza to, że rynek staje się nieco przegrzany. Jeśli momentum cenowe zatrzyma się, nadmiernie lewarowane pozycje długie mogą mieć kłopoty, a wynikające z tego likwidacje mogą spowodować gwałtowny spadek.
Sygnaly on-chain sugerują ostrożność
Patrząc szerzej, analitycy twierdzą, że metryki on-chain dają ciche ostrzeżenie. Wskaźnik MVRV, który śledzi, ile zysku mają posiadacze, wzrósł do 37,87%. Oznacza to, że wiele osób jest teraz na plusie, a historycznie to moment, w którym wielu zaczyna realizować zyski. To nie jest sygnał sprzedaży sam w sobie, ale przypomnienie, że FOMO nie jest jedyną siłą na rynku.
Jest też wskaźnik NVT, który ciągle rośnie. Ten wskaźnik porównuje kapitalizację rynkową do aktywności sieci, a rosnące wartości sugerują, że cena rośnie szybciej niż rzeczywiste wykorzystanie. Więc choć rajd wygląda świetnie na papierze, porusza się szybciej niż fundamenty, co nigdy nie jest dobrym wzorcem długoterminowym.
Rzeczywista adopcja Chainlink dodaje paliwa
Mimo to, ten rajd to nie tylko spekulacja. Technologia Chainlink zdobywa uznanie w realnej gospodarce, co nie jest sprawą błahą.
Weźmy na przykład Tokenyze. Niedawno dołączyli do programu Chainlink BUILD, a ich celem jest tokenizacja aktywów fizycznych – metali takich jak miedź i aluminium, zabezpieczonych rzeczywistymi kwitami magazynowymi. To nie są cyfrowe obietnice – to prawdziwe, namacalne towary przeniesione na łańcuch za pomocą Proof of Reserve Chainlink, aktualnych feedów cenowych i protokołów interoperacyjności cross-chain.
Tokenyze wykorzystuje standardy ERC-3643 do tworzenia tokenów, które można opakować w ERC-20, co czyni je natychmiast kompatybilnymi z platformami DeFi. Inwestorzy mogą kupować, pożyczać lub używać tych tokenów zabezpieczonych aktywami jako zabezpieczenia, tak jak każdą kryptowalutę, ale opartą na realnej wartości.
To nie jest tylko nagłówek partnerski. To wyraźny znak, że Chainlink ewoluuje z dostawcy oracle w warstwę infrastruktury dla tokenizowanych finansów. Współpraca obejmuje również dzielenie się przez Tokenyze częścią swojego natywnego zapasu tokenów z uczestnikami stakingu Chainlink i dostawcami usług – model, który wyrównuje zachęty i wzmacnia ekosystem.
Prognoza ceny Chainlink: Czy LINK przebije 25 USD?
Rajd ma realne podstawy, według analityków. Jest popyt na rynku spot, entuzjazm na rynku instrumentów pochodnych i adopcja na poziomie instytucjonalnym – wszystko to zbiega się w jednym czasie. Ale to nie oznacza, że droga do 25 USD będzie prosta.
Tak, momentum jest silne, i jeśli LINK przebije opór w okolicach 18,81 USD, droga do 25 USD szybko się otworzy. Jednak podwyższony poziom otwartych pozycji, portfele z dużymi zyskami i chwiejne wskaźniki on-chain sugerują, że możemy zobaczyć test nerwów przed kolejnym wzrostem.
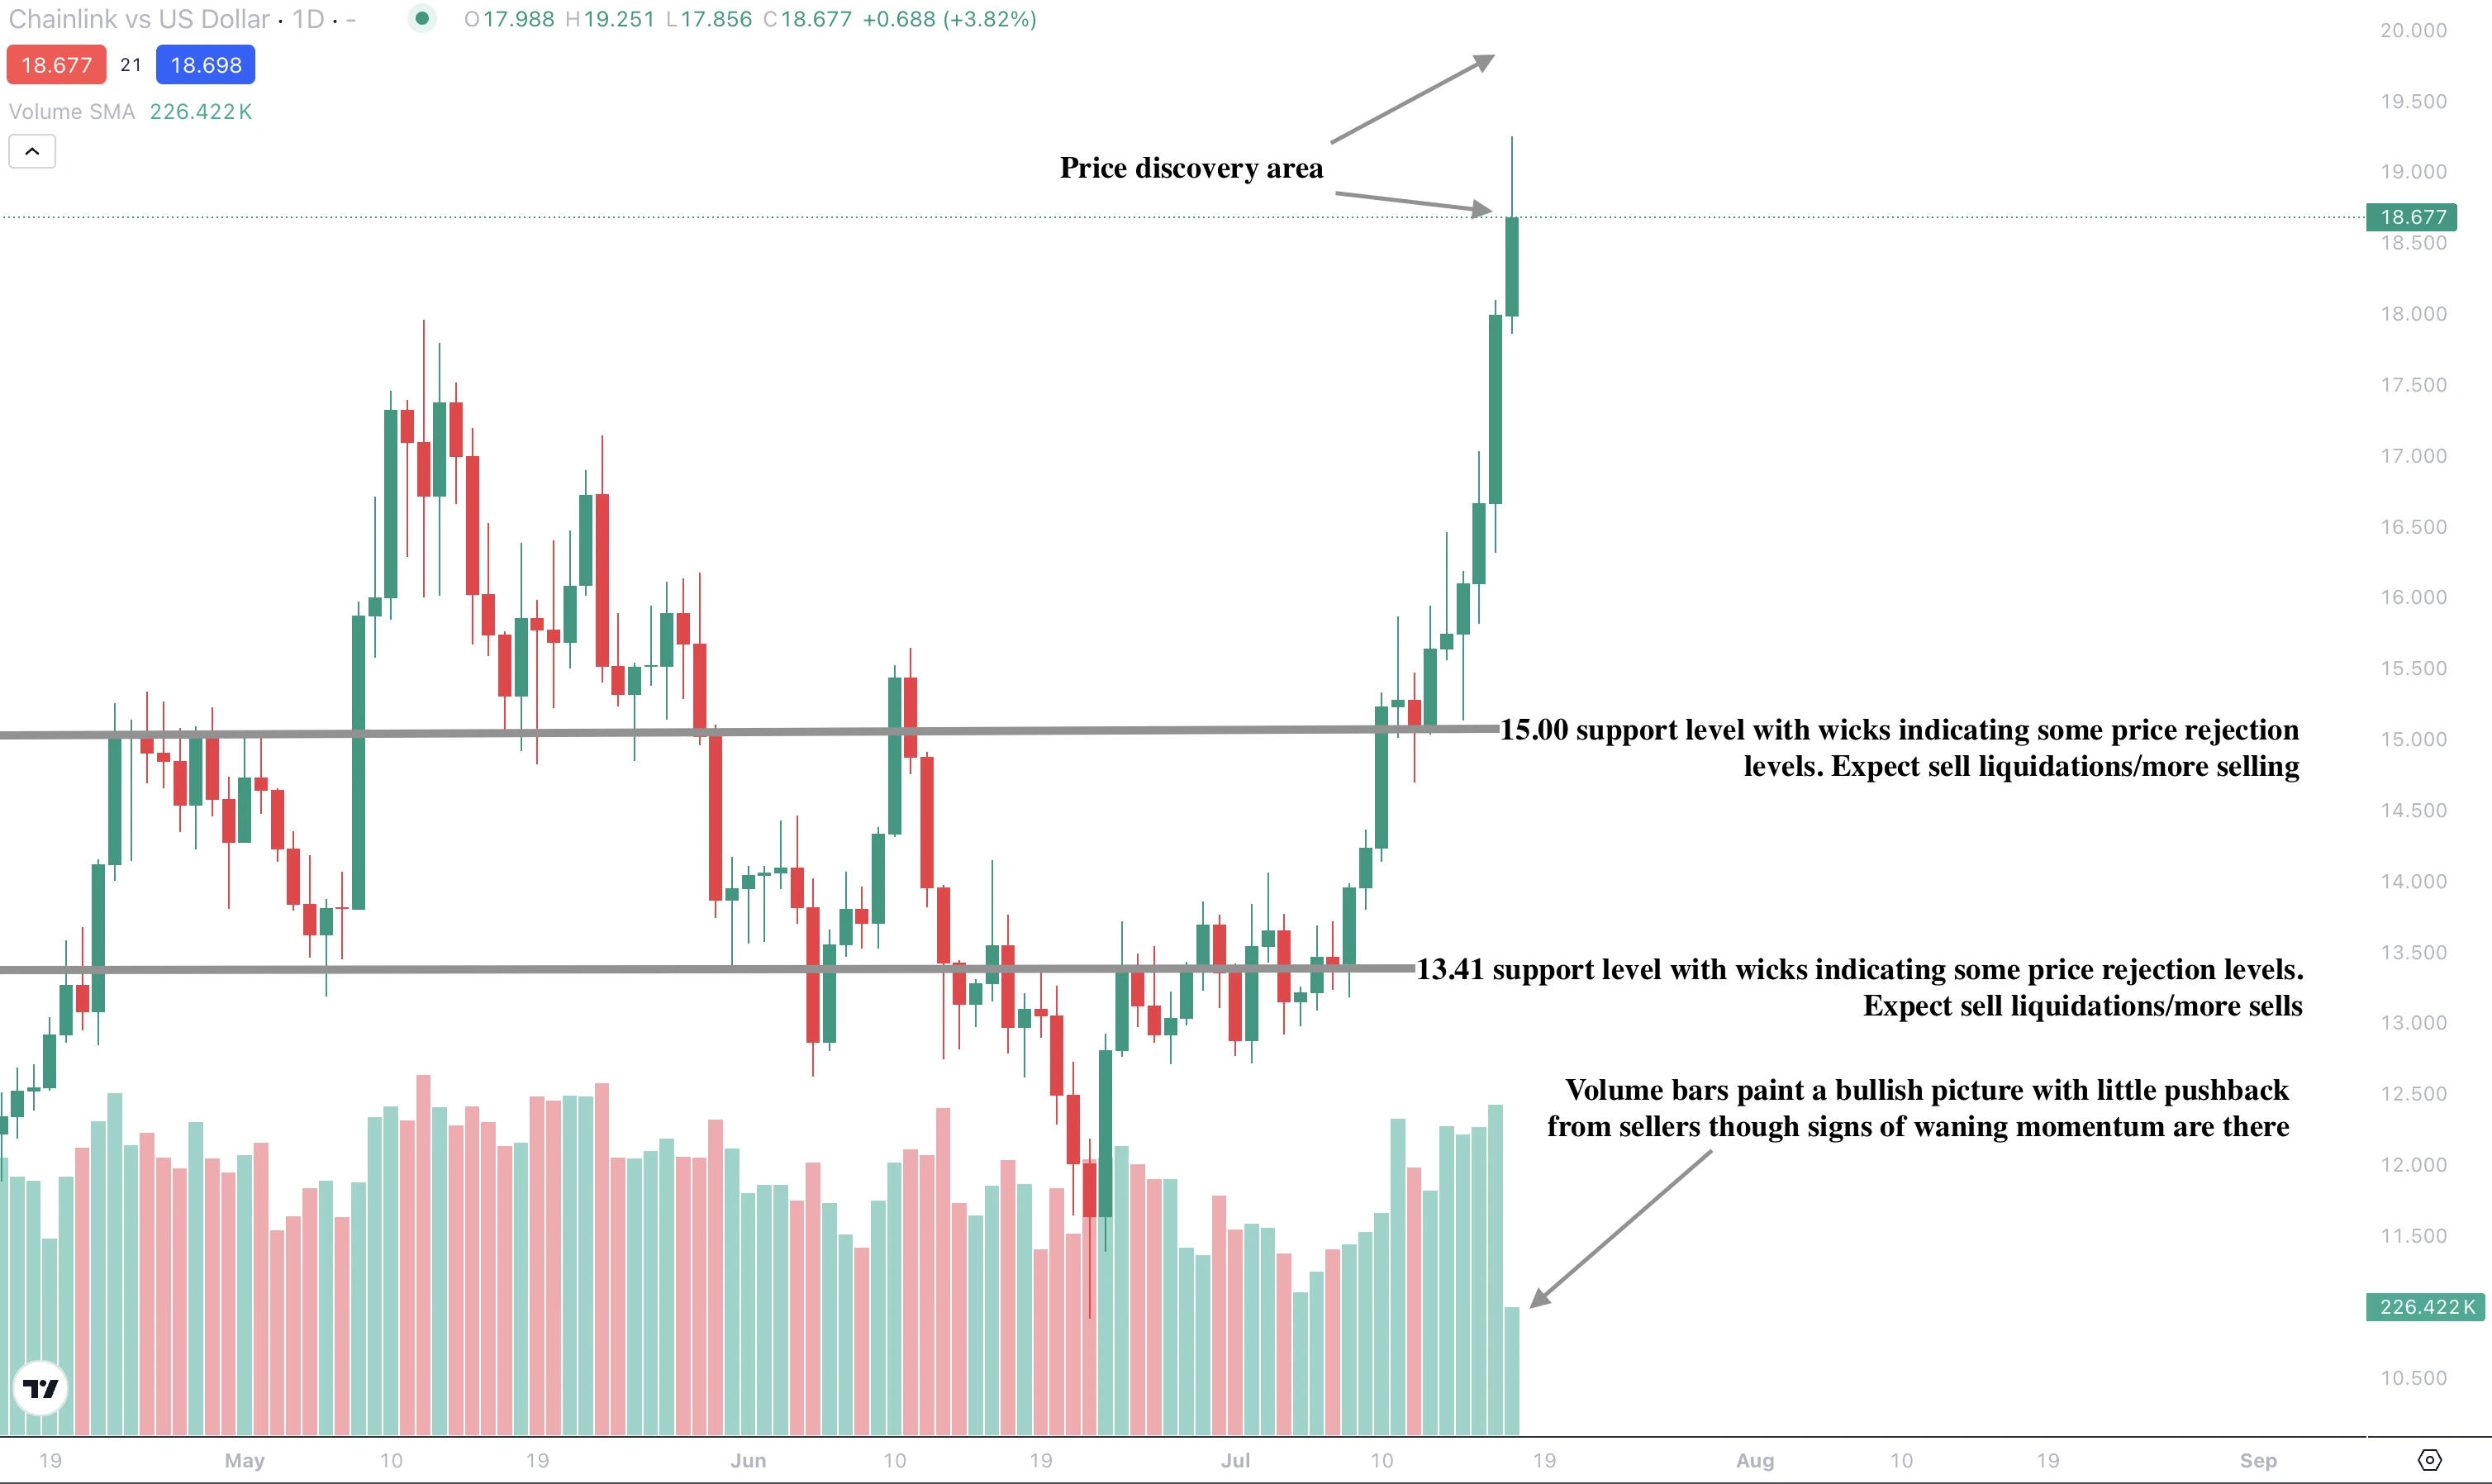
W chwili pisania, Chainlink nadal rośnie, ale pojawiają się oznaki słabnącego momentum, z dużym knotem tworzącym się na szczycie. Zobaczymy, czy knot będzie oznaczał wyczerpanie ceny, czy też wzrost przyspieszy ponownie. Jeśli zobaczymy wzrost, byki będą w trybie odkrywania cen na drodze do 25 USD. Natomiast jeśli nastąpi odwrócenie ceny, sprzedający mogą znaleźć wsparcie na poziomach 15,00 i 13,41 USD.
Spekuluj na ruchach LINK za pomocą konta Deriv MT5 już dziś.
Zastrzeżenie:
Przytoczone wyniki nie gwarantują przyszłych rezultatów.


