Gold is crashing: Pullback or the start of a downward trend?

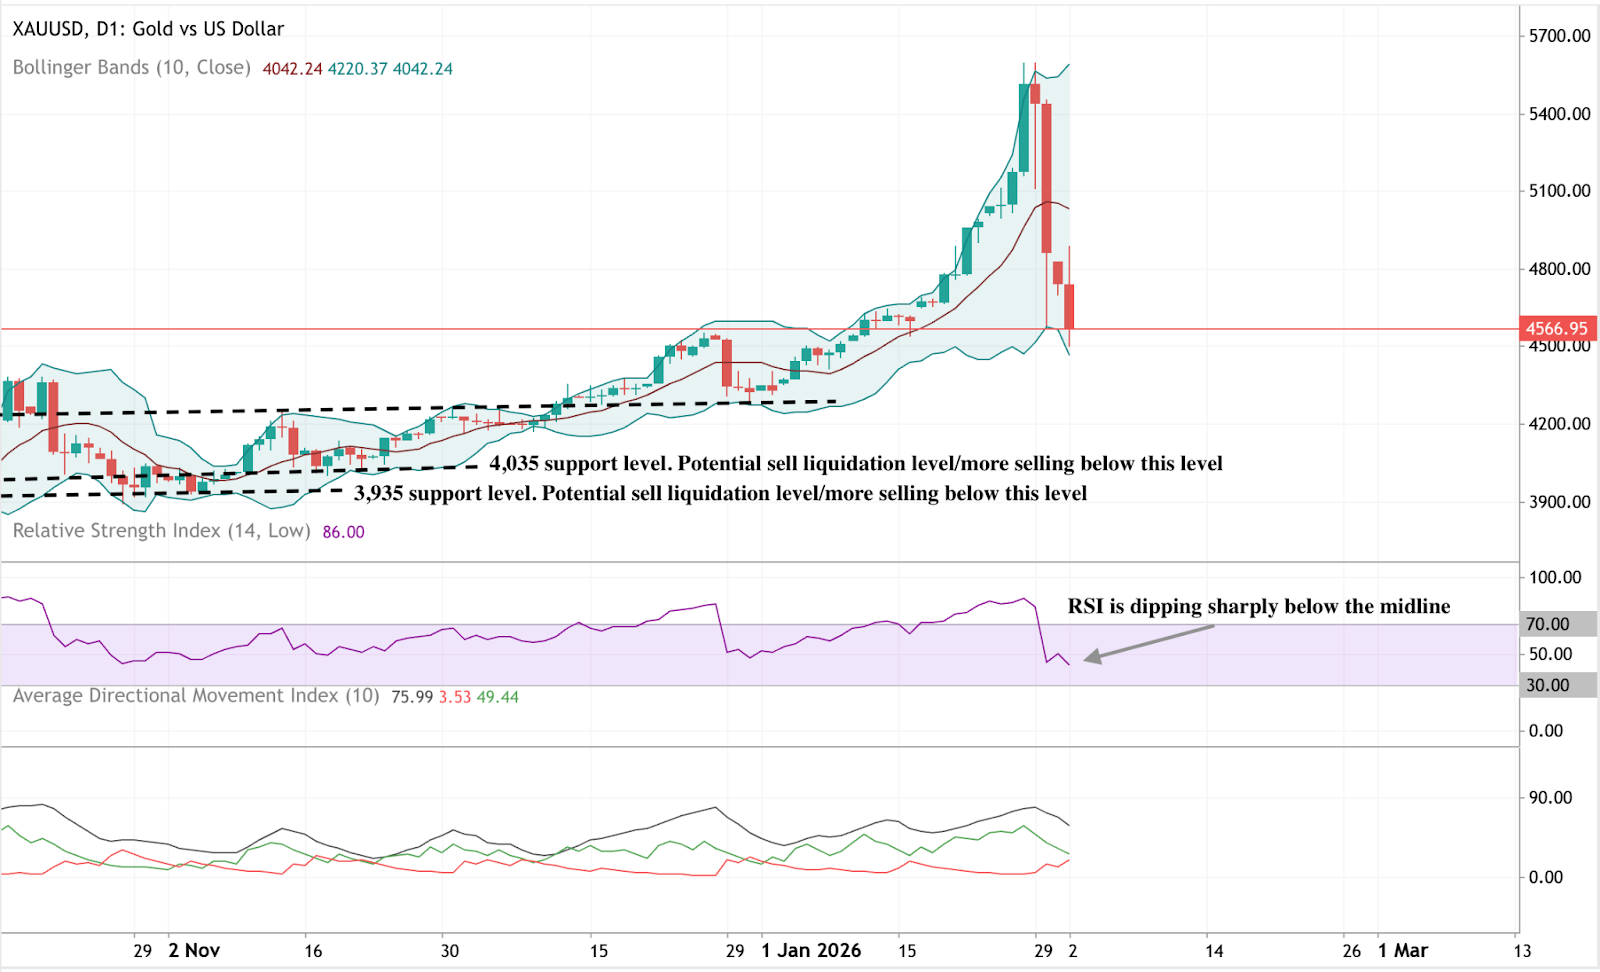
Gold’s sharp sell-off looks more like a violent pullback than the start of a sustained bear market - but it has exposed how fragile sentiment had become at record highs, analysts note. After surging above $5,600 per ounce earlier this year, gold has fallen hundreds of dollars in a matter of days, with silver suffering an even steeper collapse. The speed of the reversal has rattled investors, yet the forces that drove gold higher have not disappeared overnight.
Prices are still far higher than a year ago, when gold traded below $2,800 per ounce, underscoring just how stretched the rally had become. What matters now is whether the recent plunge reflects a healthy reset after speculative excess, or a deeper shift in the macro environment that could cap gold’s upside for months to come.
What’s driving gold’s sudden crash?
Gold’s ascent into 2026 was powered by a rare alignment of fear, policy uncertainty and structural demand. Central banks accumulated bullion at a record pace, investors sought protection from ballooning US debt, and markets questioned the Federal Reserve’s independence amid Donald Trump’s repeated attacks on monetary policy. Gold rose more than 90% year on year, posting its strongest annual performance since 1979.
The reversal was triggered when one of those fears eased. Trump’s nomination of former Federal Reserve governor Kevin Warsh as the next Fed chair was interpreted by markets as a stabilising signal rather than a threat. Concerns over central bank independence softened, the US dollar strengthened, and profit-taking intensified. Once prices slipped below key technical levels, selling accelerated as speculative positions were unwound.
Why the move matters
Gold no longer trades as a slow-moving defensive asset. Its extreme volatility reflects how central it has become to global risk pricing across currencies and sovereign debt. When gold surges, it signals deep mistrust in financial and political systems. When it collapses, it suggests that fear may have been overextended.
Daniel McDowell, a professor of political science at Syracuse University, has described gold buying during periods of instability as a psychological rather than purely rational response. That distinction helps explain why reversals can be so abrupt. When confidence improves, even marginally, gold does not drift lower - it reprices aggressively.
Impact on investors, markets and central banks
For investors, the crash has been a lesson in timing. Exchange-traded funds linked to gold saw heavy inflows as prices surged, only to experience rapid outflows once the sell-off began. Retail participation, particularly in physical gold and jewellery, spiked near the highs before fading just as quickly.
Central banks now sit at a crossroads. While gold remains one of the few unleveraged sovereign assets, fiscal pressure could tempt some governments to liquidate reserves. Nigel Green, CEO of deVere Group, warned that “the temptation to mobilise gold reserves is real” when political and financial strain intensifies. Any meaningful selling by official institutions would add to downside risks.
Expert outlook: correction or trend reversal?
Analysts are sharply divided. A Financial Times survey of eleven strategists puts the consensus 2026 year-end price near $4,600 per ounce, below current levels even after the crash.
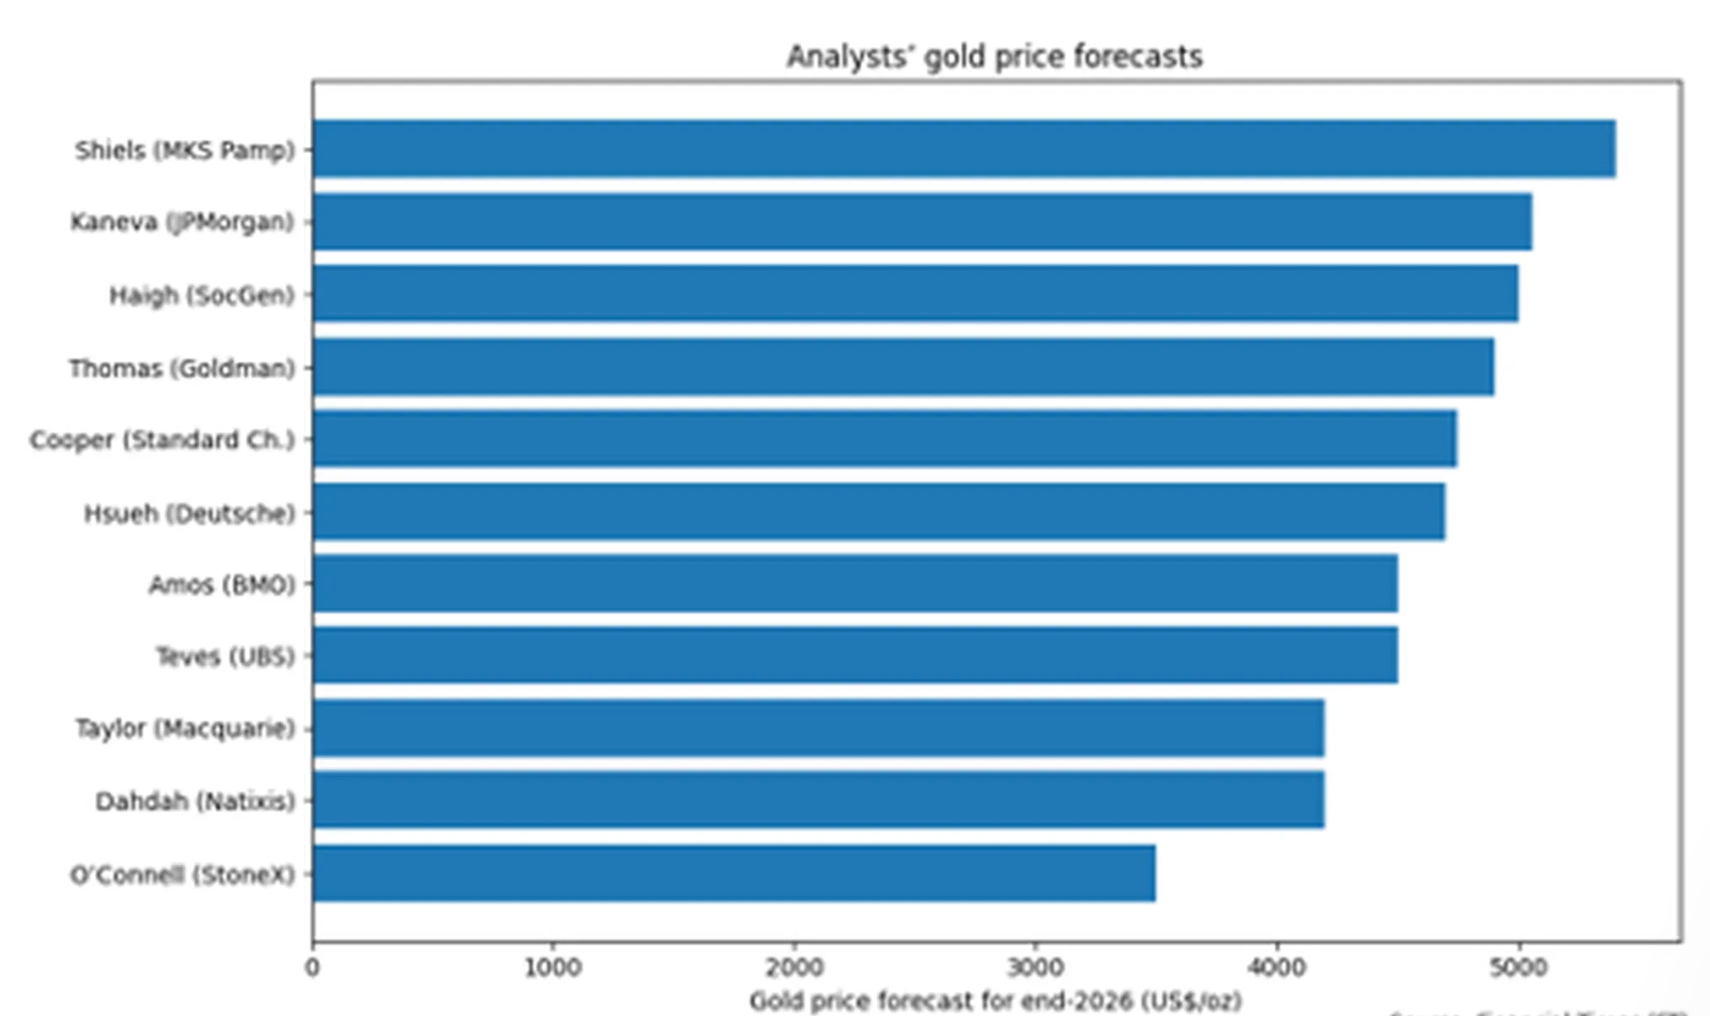
Macquarie expects gold closer to $4,200 by the final quarter of the year, arguing that speculation has overtaken fundamentals.
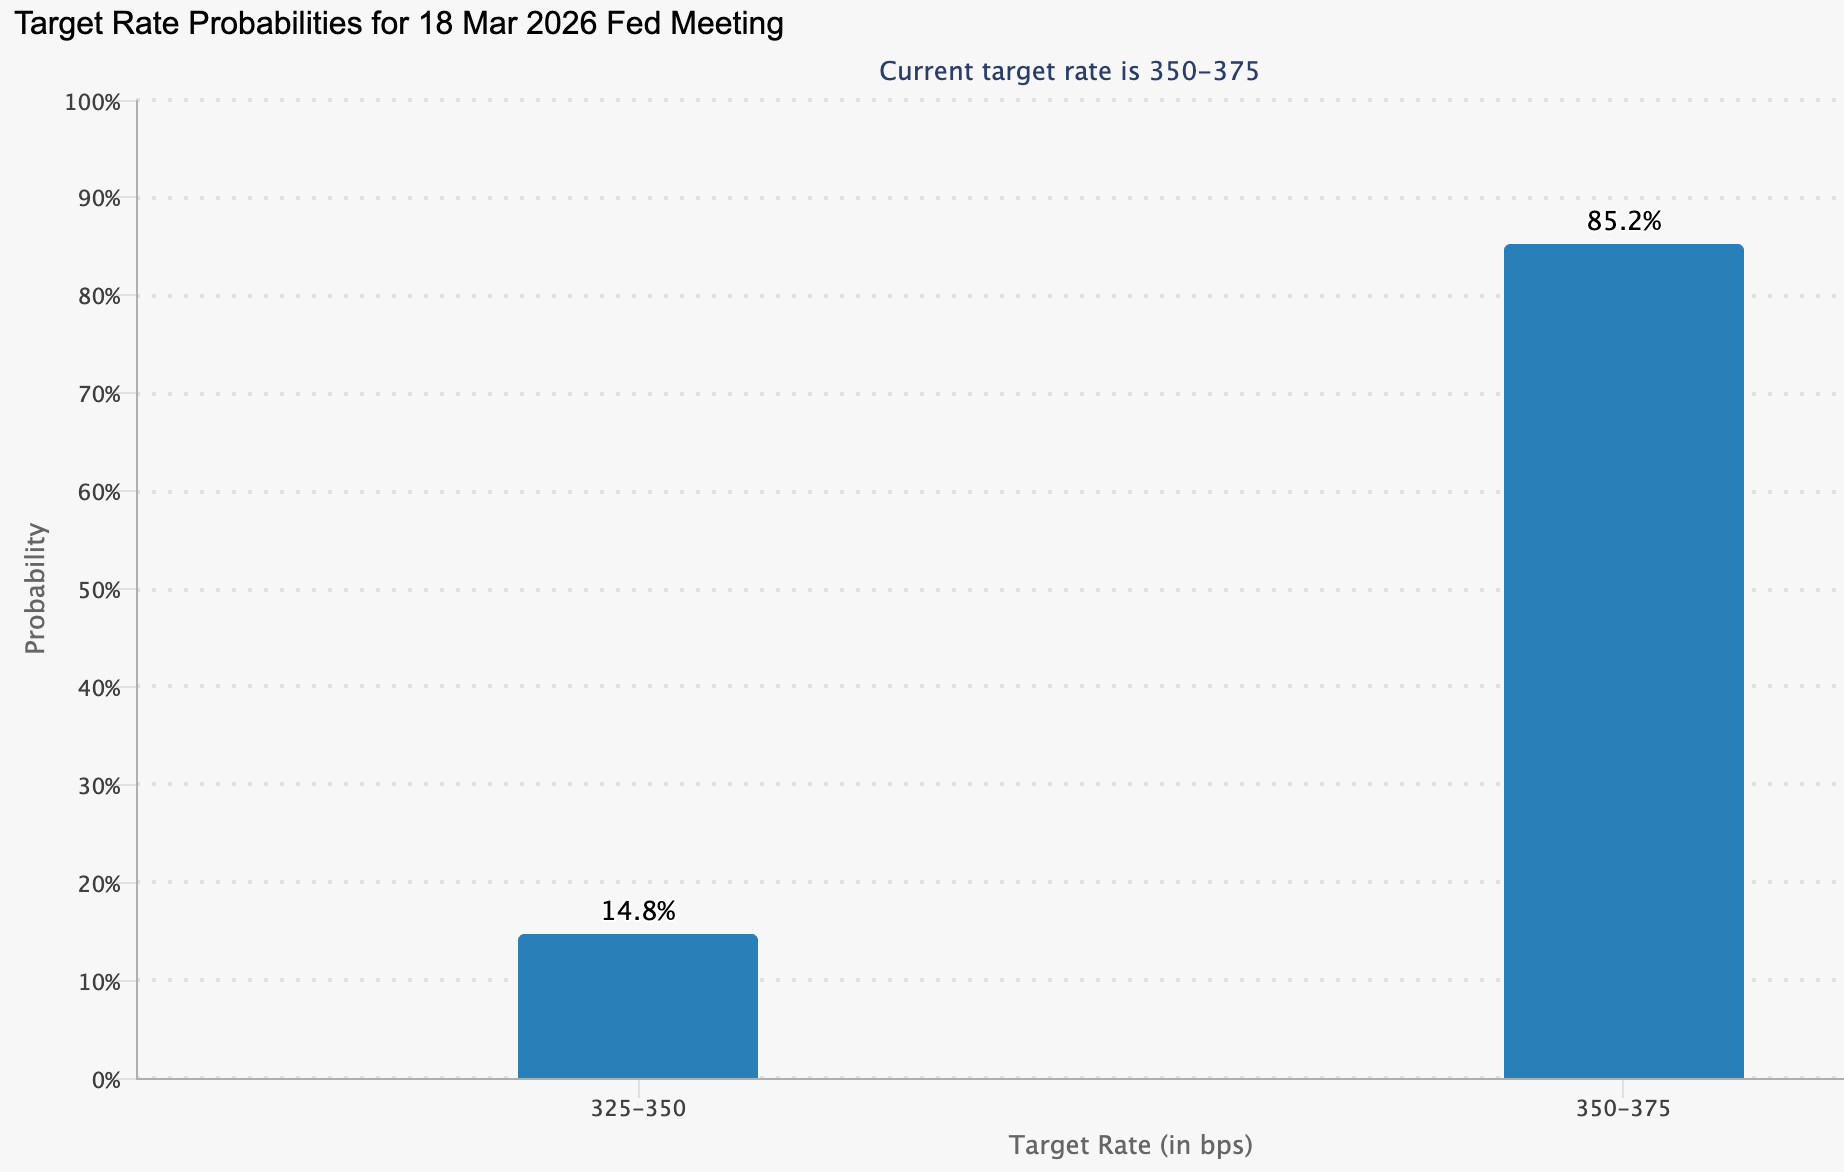
Others remain constructive. UBS believes gold could still climb above $6,000 in the coming months, supported by geopolitical risk, de-dollarisation and expected interest rate cuts. Markets currently price an 87% chance that US rates remain unchanged in the near term, with the first cut likely later in the year. A weaker dollar would once again strengthen gold’s appeal.
Key takeaway
Gold’s crash looks less like the end of the bull market and more like a brutal reset after speculative excess. The forces that drove prices higher - debt, geopolitics and distrust in fiat currencies - remain in place, but sentiment has shifted sharply. Whether gold resumes its climb or enters a longer consolidation phase will depend on interest rates, central bank behaviour and geopolitical developments. For now, volatility is the price of conviction.
Bitcoin technical outlook
Bitcoin has extended its recent decline, moving toward the lower end of its broader price structure after breaking down from a prolonged consolidation phase. Price is trading near the lower Bollinger Band, while the bands themselves remain expanded, reflecting elevated volatility and sustained downside pressure.
Momentum indicators show a sharp deterioration in short-term momentum, with the RSI dipping decisively into oversold territory. Trend strength remains elevated, as indicated by high ADX readings, although directional indicators show downside dominance following the recent acceleration lower.
Structurally, price has moved well below the former consolidation area around $90,000, with earlier resistance zones near $107,000 and $114,000 now significantly above current levels.
The performance figures quoted are not a guarantee of future performance.


