Uncja srebra kosztuje teraz więcej niż baryłka ropy
%2520(1)%2520(1)%2520(1)%2520(1)%2520(1)%2520(1)%2520(1)%2520(1).png)
22 grudnia 2025 r. na światowych rynkach surowcowych doszło do niezwykłego wydarzenia: uncja srebra była notowana po około 67–68 dolarów za uncję trojańską, przewyższając cenę baryłki ropy West Texas Intermediate (WTI), która oscylowała wokół 56–57 dolarów, według doniesień.
Brent, międzynarodowy benchmark, był nieco wyżej – około 60–61 dolarów, ale sedno pozostało to samo – jedna uncja białego metalu była warta więcej niż 42 galony czarnego złota.
Ta inwersja nie miała miejsca od ponad czterech dekad; ostatni podobny epizod miał miejsce podczas burzliwego boomu surowcowego pod koniec lat 70. i na początku 80. Wówczas spekulacyjna gorączka na krótko wywindowała ceny srebra powyżej cen ropy. Dziś to przecięcie, które po raz pierwszy nastąpiło wcześniej w 2025 r., gdy srebro przebiło 54 dolary, a ropa utrzymywała się w przedziale 65–75 dolarów, wydaje się bardziej strukturalne niż spekulacyjne. Analitycy nazywają to „momentem przełomowym” roku 2025, odzwierciedlającym głębokie zmiany w sposobie, w jaki świat wycenia energię i surowce.
Co napędza gwałtowny rajd srebra
Srebro ma za sobą jeden z najbardziej spektakularnych lat w historii, rosnąc o około 127–130% od początku roku do rekordowych poziomów powyżej 67 dolarów, według danych. To przewyższa silny wzrost złota o ~60–65%, podkreślając wyjątkową podwójną rolę srebra jako zabezpieczenia monetarnego i potęgi przemysłowej.
Rajd opiera się na ograniczonej podaży fizycznej i eksplodującym popycie. Raporty pokazują, że światowa produkcja srebra z kopalń utknęła w miejscu, a recykling nie jest w stanie zniwelować luki, co prowadzi do utrzymujących się deficytów rynkowych – prognozowanych na 95–149 milionów uncji tylko w 2025 r., co oznacza piąty z rzędu rok niedoborów. Skumulowane deficyty od 2021 r. przekraczają już 800 milionów uncji, co wyczerpuje zapasy do najniższych poziomów od dekad.
Prawdziwym motorem jest konsumpcja przemysłowa, odpowiadająca za ponad 60% popytu. Niezrównana przewodność elektryczna srebra czyni je niezastąpionym w zielonych technologiach:
- Energia słoneczna: Panele fotowoltaiczne zużyły ponad 200 milionów uncji w ostatnich latach, a popyt gwałtownie rośnie wraz z boomem instalacji na świecie. Każdy panel wykorzystuje 15–25 gramów srebra, a ambitne cele (np. 700 GW w UE do 2030 r.) zapowiadają trwały wzrost.
- Pojazdy elektryczne (EV): Typowy EV wymaga 25–50 gramów srebra – dwa razy więcej niż tradycyjne samochody – do baterii, elektroniki i infrastruktury ładowania. Popyt motoryzacyjny ma rosnąć o 3–4% rocznie do 2031 r.
- Elektronika i AI: Centra danych, sieci 5G i półprzewodniki dodatkowo zwiększają zapotrzebowanie, a potrzeby energetyczne napędzane przez AI potęgują zużycie.
W innych raportach makroekonomiczne czynniki dodatkowo wzmocniły ten ruch: oczekiwania na obniżki stóp procentowych przez Fed (wyceniające dalsze luzowanie w obliczu słabnącej inflacji i rosnącego bezrobocia do 4,6%), słabszy dolar amerykański (spadek o ~8–9% YTD) oraz napływ kapitału do bezpiecznych przystani w obliczu niepewności geopolitycznej. Dodanie srebra do amerykańskiej listy minerałów krytycznych przyciągnęło zainteresowanie instytucjonalne, traktując je jako strategiczny zakład na transformację energetyczną.
Dlaczego ropa nie nadąża
Dla kontrastu, ropa naftowa ma za sobą brutalny rok 2025 – WTI spadła o 18–20% od początku roku, co zapowiada najgorszy roczny wynik od pandemicznego krachu w 2020 r. Ceny spadły do poziomów najniższych od prawie pięciu lat, zanim nastąpiły umiarkowane odbicia po wydarzeniach takich jak sankcje USA na tankowce wenezuelskie.
Przyczyna? Chroniczna nadpodaż, według ekspertów. Producenci spoza OPEC+ (na czele z amerykańskim łupkiem na rekordowym poziomie ~13,5–13,8 mln baryłek dziennie, a także wzrostem w Brazylii i Gujanie) zalali rynek. OPEC+ stopniowo wycofywał dobrowolne cięcia, dodając setki tysięcy baryłek dziennie, podczas gdy światowe zapasy rosną w szybkim tempie. Zapasy ropy gwałtownie wzrosły od lata.
Wzrost popytu rozczarował, zwłaszcza w Chinach (pomimo gromadzenia zapasów) oraz słabnąc w Europie i USA w związku z poprawą efektywności i wolniejszym tempem wzrostu gospodarczego. Prognozy wskazują, że nadwyżki utrzymają się do 2026 r., a Brent może średnio kosztować 55 dolarów lub mniej, jeśli zapasy będą nadal rosnąć.
Wybuchy napięć geopolitycznych przynoszą krótkotrwałe wzrosty, ale nie zdołały odwrócić trendu spadkowego na dobrze zaopatrzonym rynku.
Dlaczego ta inwersja ma znaczenie: Okno na globalne zmiany
Ten moment, gdy srebro przewyższa ropę, to nie tylko ciekawy nagłówek – to barometr głębszych przemian.
Podkreśla on trwającą transformację energetyczną: rynki nagradzają surowce powiązane z dekarbonizacją (energia słoneczna, EV, odnawialne źródła), jednocześnie dyskontując tradycyjne paliwa kopalne. Srebro, określane mianem „nowego metalu energetycznego”, symbolizuje wzrost zielonych technologii, podczas gdy ropa zmaga się z narracjami o szczytowym popycie i obfitej podaży.
Według ekspertów gwałtownie kurczący się stosunek złota do srebra (spadek do ~70:1 z ponad 100:1) wskazuje, że inwestorzy stawiają na przemysłowy potencjał srebra, obok jego walorów monetarnych, w erze łagodzenia polityki i czujności wobec inflacji.
Historycznie takie ekstrema przypominają skoki z lat 70. i 80., gdy inflacja i boom surowcowy wywoływały gwałtowne wahania. Dzisiejszy rajd wydaje się bardziej oparty na fundamentach, ale historia ostrzega przed zmiennością – ruchy paraboliczne często poprzedzają gwałtowne korekty.
Dla inwestorów to odwraca dotychczasowy porządek na rynku surowców: to, co kiedyś było „królem” (ropa), teraz ustępuje metalowi długo postrzeganemu jako drugorzędny. Portfele nastawione na tematy transformacyjne mogą zyskać, ale ryzyka pozostają – spowolnienie gospodarcze może ograniczyć popyt przemysłowy, a dyscyplina OPEC+ (lub jej brak) może wpłynąć na ceny ropy.
Patrząc w przyszłość: hossa, bessa czy nowa normalność?
Trajektoria srebra wskazuje na dalsze wzrosty, jeśli deficyty się utrzymają, a zielony popyt przyspieszy – niektórzy analitycy przewidują 70–75 dolarów do końca 2026 r. Jednak wykupienie techniczne i niska płynność w okresie świątecznym mogą sprzyjać korektom.
Ceny ropy mogą się ustabilizować, jeśli OPEC+ ograniczy wydobycie lub popyt zaskoczy pozytywnie, ale prognozy nadpodaży sugerują dłuższą presję. Ostatecznie 22 grudnia 2025 r. to coś więcej niż przecięcie się cen; to sygnał, że światowa gospodarka przechodzi na nowe tory – zrównoważony rozwój, technologię i odporność. W tej nowej erze uncja srebra może świecić jaśniej niż baryłka ropy przez kolejne lata.
Wskazówki techniczne
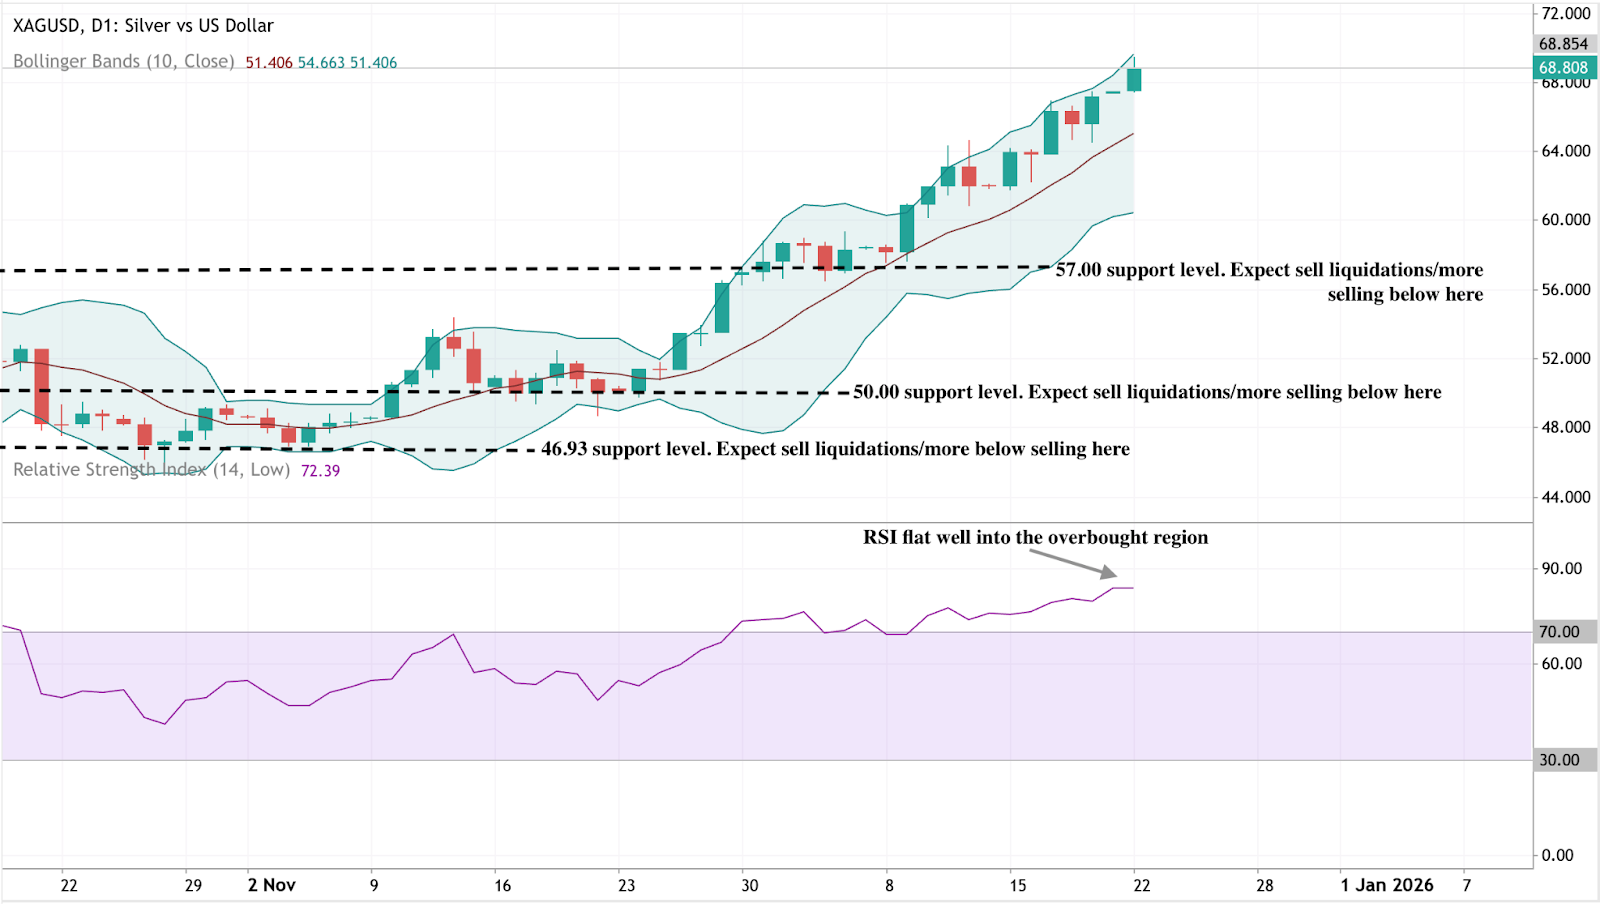
Srebro pozostaje wyraźnie w trendzie wzrostowym, a cena utrzymuje się przy górnej wstędze Bollingera, sygnalizując silny impet wzrostowy, ale także wykupienie rynku. Strome nachylenie wstęg podkreśla utrzymującą się presję zakupową, choć w krótkim terminie nie można wykluczyć konsolidacji.
Po stronie spadkowej pierwszym kluczowym wsparciem jest 57,00 USD, następnie 50,00 USD i 46,93 USD. Przebicie tych poziomów prawdopodobnie wywołałoby likwidacje pozycji długich i głębszą korektę. Impet pozostaje wysoki, a RSI utrzymuje się płasko w strefie wykupienia, co wzmacnia siłę trendu, ale ostrzega, że dalsze wzrosty mogą zwolnić bez korekty.
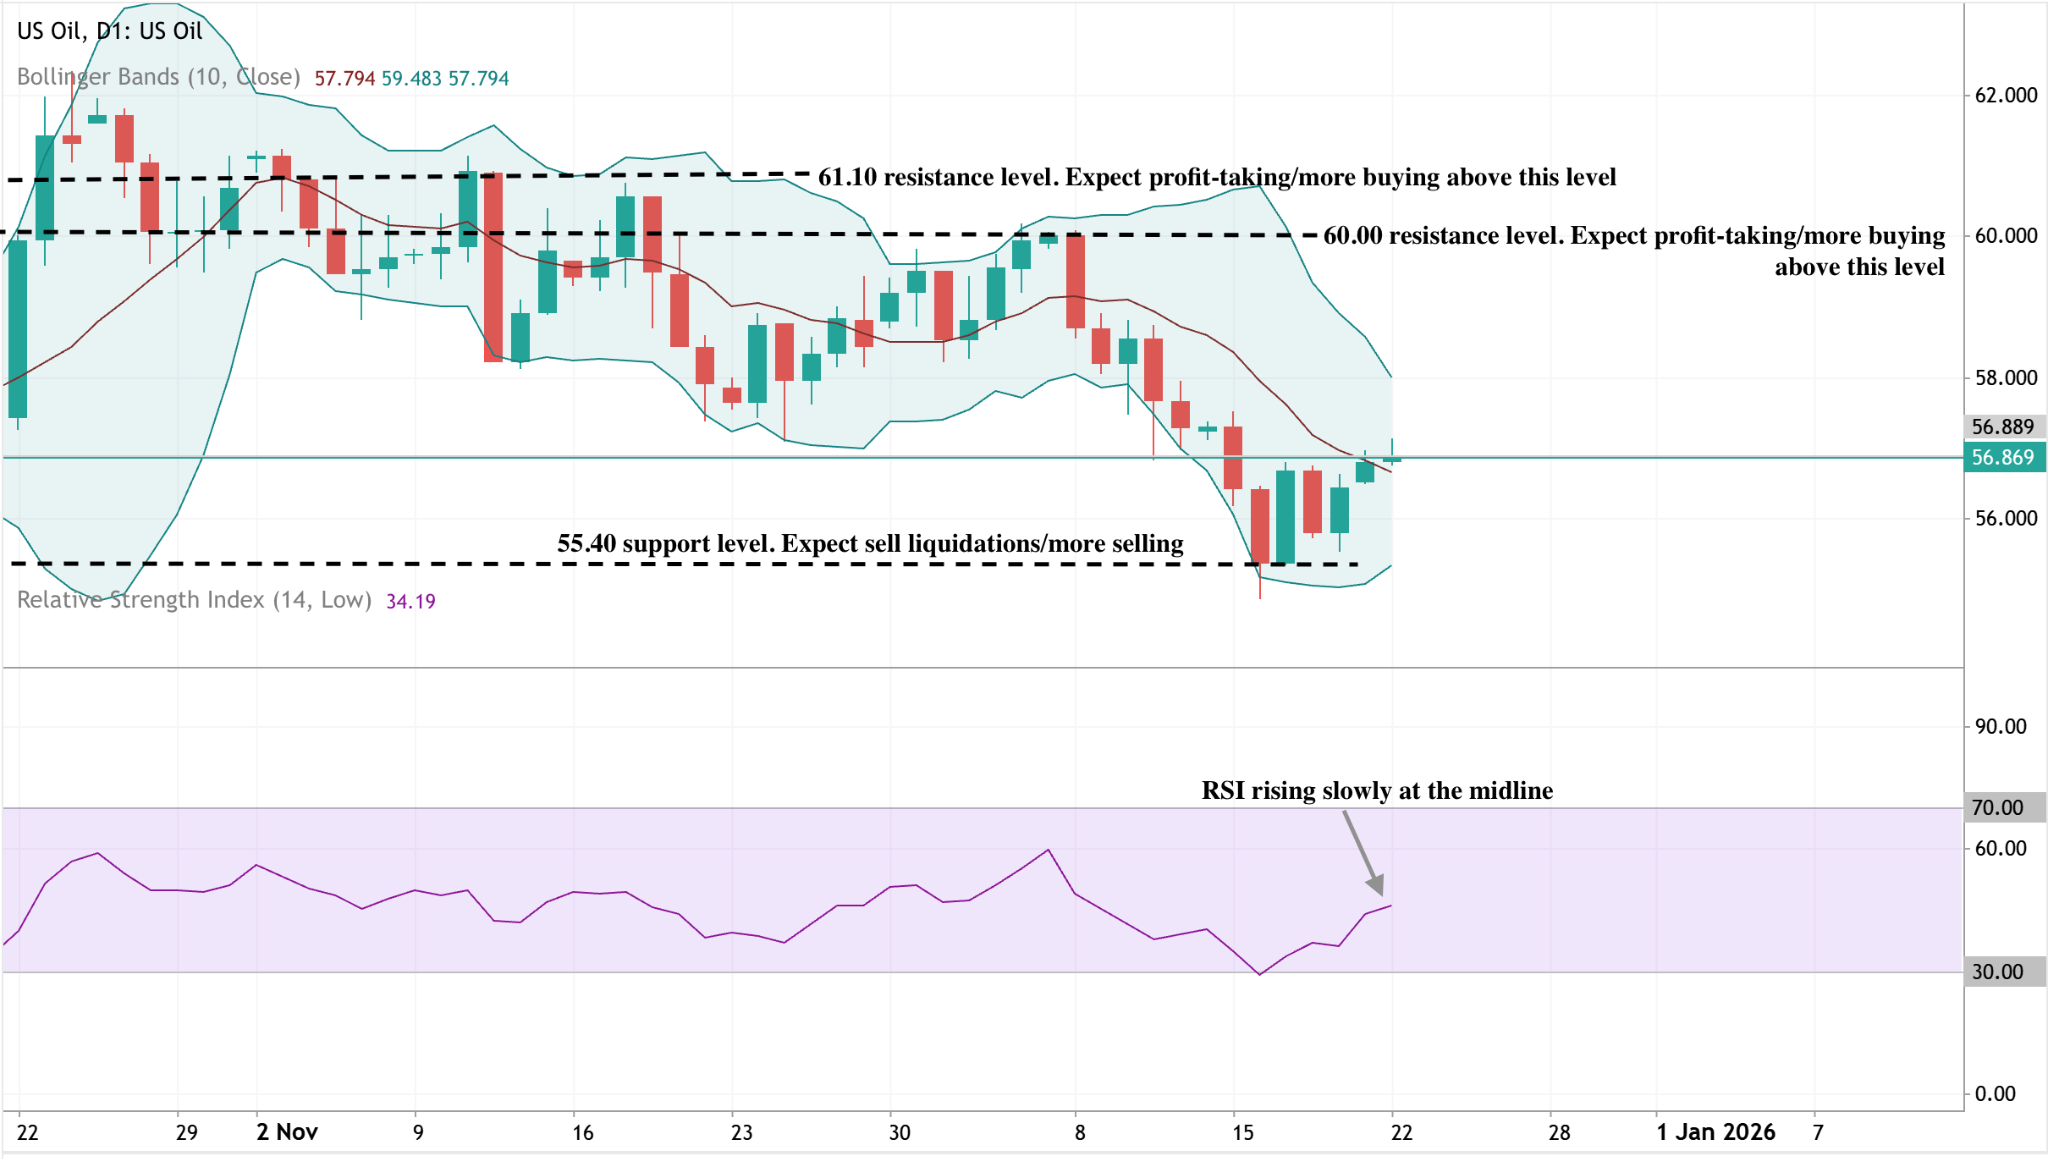
Ropa amerykańska pozostaje pod presją w krótkim terminie, a cena utrzymuje się poniżej strefy oporu 60,00–61,10 USD i jest ograniczona przez górną wstęgę Bollingera. Szeroka struktura nadal wskazuje na fazę korekcyjną, choć impet sprzedaży zaczął słabnąć.
Po stronie spadkowej kluczowym wsparciem jest 55,40 USD, gdzie przebicie prawdopodobnie wywołałoby likwidacje pozycji długich. Impet próbuje się ustabilizować, a RSI powoli rośnie z poziomów wyprzedania w kierunku linii środkowej, co sugeruje, że presja spadkowa słabnie, ale brakuje wyraźnego przekonania do wzrostów.
Przedstawione wyniki nie stanowią gwarancji przyszłych rezultatów.


