বিশ্লেষণ: স্বর্ণের দাম এবং মার্কিন স্টকের সমান্তরাল উত্থানের কারণ কী?
স্বর্ণের দাম এবং মার্কিন স্টকের সমান্তরাল উত্থান কিছুটা অস্বাভাবিক, কারণ ঐতিহ্যগতভাবে, স্বর্ণকে একটি "নিরাপদ আশ্রয়" সম্পদ হিসেবে বিবেচনা করা হয় যা অর্থনৈতিক অনিশ্চয়তার সময় ভাল পারফর্ম করে, যেখানে স্টকগুলি অর্থনৈতিক বৃদ্ধি এবং ঝুঁকি গ্রহণের সাথে বেশি সম্পর্কিত। বিশ্লেষকদের মতে, একাধিক কারণ একসাথে উভয় বাজারকে উচ্চতর দিকে চালিত করছে।
CME-এর FedWatch টুল অনুযায়ী, ট্রেডাররা ডিসেম্বর মাসে ২৫ বেসিস পয়েন্টের হ্রাসের ৬৩% সম্ভাবনা দেখছেন। সেই একক কাহিনী - সস্তা অর্থ - এমন সম্পদগুলিকে উত্থিত করছে যা সাধারণত বিপরীত দিক দিয়ে চলে: স্বর্ণ, ক্লাসিক নিরাপদ আশ্রয়, এবং স্টক, ঐতিহ্যবাহী ঝুঁকি বিনিয়োগ।
উভয় বাজারই অর্থনৈতিক শক্তির পরিবর্তে নীতিমালা-চালিত আশাবাদ থেকে লাভ করছে। দুর্বল কর্মসংস্থান তথ্য, নরম ভোক্তা মনোভাব, এবং আর্থিক চাপের লক্ষণ ট্রেডারদের নরম মুদ্রানীতি প্রত্যাশার দিকে পরিচালিত করছে, যা একটি তরলতা উত্থানকে জ্বালানি দিচ্ছে যা নিরাপত্তা এবং জল্পনার মধ্যে সীমানা মুছে দিচ্ছে।
মূল বিষয়সমূহ
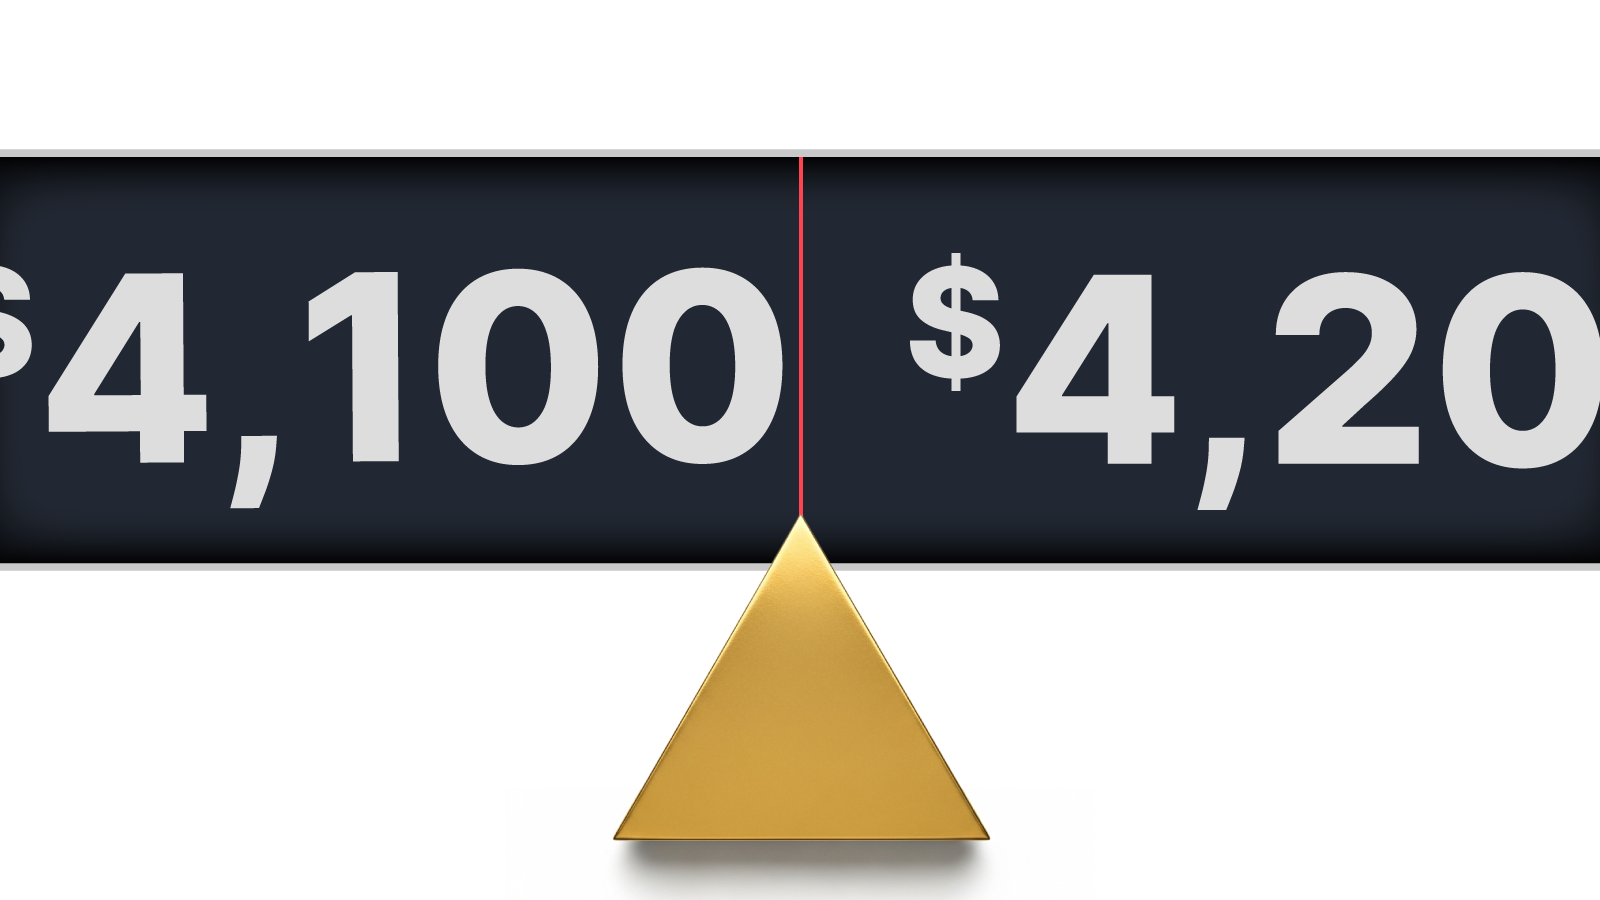
- স্বর্ণ প্রতি আউন্স $৪,১০০ এর উপরে রয়েছে, যা দুই সপ্তাহের মধ্যে সর্বোচ্চ, কারণ ট্রেডাররা Fed-এর শিথিলতা প্রত্যাশা করছেন।
- নিম্নতর সুদের প্রত্যাশা ভবিষ্যত আয়ের মূল্যায়ন বাড়ানোর কারণে মার্কিন ইক্যুইটিও বৃদ্ধি পাচ্ছে।
- এই উত্থান তরলতা আস্থাকে প্রতিফলিত করে, বৃদ্ধি নয় - একটি বাজার যা কেন্দ্রীয় ব্যাংক দ্বারা চালিত, মৌলিক বিষয় দ্বারা নয়।
- আর্থিক উদ্বেগ এবং বাড়তে থাকা মার্কিন Treasury yields স্বর্ণের জন্য দ্বিতীয় স্তরের সমর্থন যোগ করে।
- ভারত এবং কেন্দ্রীয় ব্যাংক থেকে শক্তিশালী শারীরিক চাহিদা জল্পনামূলক তরঙ্গের নিচে দামকে সমর্থন করে।
Fed রেট কাটার আহ্বান স্বর্ণ এবং মার্কিন স্টক চালিত করছে
এই যৌথ উত্থান একটি স্পষ্ট ম্যাক্রো পরিবর্তন থেকে উদ্ভূত। সাম্প্রতিক মার্কিন অর্থনৈতিক তথ্য গতিশীলতা হারানোর ইঙ্গিত দিয়েছে - অক্টোবর মাসে ব্যক্তিগত কর্মসংস্থান দুর্বল হয়েছে, সরকারী এবং খুচরা চাকরি কমেছে, এবং ভোক্তা মনোভাব মাসের মধ্যে সর্বনিম্নে নেমে এসেছে। বাজারগুলি এটিকে Fed ডিসেম্বর মাসে রেট কাটার দিকে ঝুঁকির নিশ্চিতকরণ হিসেবে ব্যাখ্যা করেছে।
নিম্ন সুদের হার একই সময়ে বাজারের উভয় দিককে প্রভাবিত করে:
- ইক্যুইটির জন্য, এটি ঋণগ্রহণকে সস্তা করে এবং কর্পোরেট আয়ের বর্তমান মূল্য বৃদ্ধি করে।
- স্বর্ণের জন্য, এটি একটি অ-উৎপাদনশীল সম্পদ ধারণের সুযোগ ব্যয় কমিয়ে দেয়।
ফলাফল হল একটি সমন্বিত উত্থান। বিনিয়োগকারীরা নিরাপত্তা এবং ঝুঁকির মধ্যে নির্বাচন করছেন না; তারা উভয়ই কিনছেন, একটি প্রত্যাশায় একত্রিত - সহজ অর্থের প্রত্যাবর্তন।
Deriv MT5-এ ট্রেডারদের জন্য, এই ক্রস-সম্পদ গতিশীলতা বৈচিত্র্যের জন্য নতুন সুযোগ তৈরি করেছে, কারণ সূচক, পণ্য, এবং ধাতুগুলির অস্থিরতা একই নীতি স্পন্দনে সাড়া দেয়।
মার্কিন আর্থিক নীতি আবার একটি গোপন চালক হিসেবে আবির্ভূত
মার্কিন সরকার শাটডাউন এবং এর অস্থির সমাধান আর্থিক স্থিতিশীলতার প্রতি মনোযোগ বাড়িয়েছে। সেনেটের দ্বিদলীয় সমঝোতা সরকার পুনরায় খোলার জন্য - প্রেসিডেন্ট ডোনাল্ড ট্রাম্পের সমর্থনে - স্বল্পমেয়াদী বাজার চাপ কমিয়েছে কিন্তু বিনিয়োগকারীদের আমেরিকার দীর্ঘমেয়াদী ঋণ সমস্যার কথা স্মরণ করিয়ে দিয়েছে।
Saxo Bank-এর Ole Hansen উল্লেখ করেছেন, “আর্থিক উদ্বেগ দ্বারা চালিত বাড়তে থাকা yields, অর্থনৈতিক শক্তির পরিবর্তে, ঐতিহাসিকভাবে বিনিয়োগ ধাতুগুলির জন্য সহায়ক হয়েছে।” এই প্রসঙ্গে, উচ্চতর বন্ড yields ঋণ টেকসইতা সম্পর্কে উদ্বেগ প্রতিফলিত করে, শক্তিশালী অর্থনীতির নয় - যা আর্থিক অনিশ্চয়তার বিরুদ্ধে হেজ হিসেবে স্বর্ণ ধারণের যুক্তি জোরদার করে।
সরকারি সংস্থাগুলির পুনরায় খোলা অফিসিয়াল অর্থনৈতিক ডেটায় প্রবেশাধিকার পুনরুদ্ধার করবে, যা বাজারকে আরও স্পষ্টতা দেবে। তবুও, সেই তথ্য সম্ভবত ক্রিয়াকলাপের ধীরগতি নিশ্চিত করবে, ট্রেডাররা Fed-এর আরও পদক্ষেপ নেওয়ার জন্য আরও যুক্তি দেখছেন।
স্বর্ণ এবং স্টক: বাজারে একটি বিরল যুগ্ম উত্থান
স্বর্ণ এবং ইক্যুইটি ঐতিহ্যগতভাবে বিপরীত দিকে চলে। এক fear প্রতিনিধিত্ব করে, অন্য confidence। তবে, ২০২৫ সালের বাজারের আচরণ নির্দেশ করে যে উভয়ই এখন তরলতা প্রত্যাশার প্রকাশ।
যখন বিনিয়োগকারীরা মুদ্রানীতি শিথিলতার প্রত্যাশা করেন, তখন সস্তা অর্থ থেকে লাভবান সবকিছু - স্বর্ণ থেকে বৃদ্ধি প্রযুক্তি স্টক পর্যন্ত - উত্থান পায়। এই সম্পর্কের পরিবর্তন বাজারের কাজ করার একটি কাঠামোগত পরিবর্তন তুলে ধরে: নীতি প্রত্যাশা মৌলিক বিষয়কে ছাড়িয়ে মূল মূল্য চালক হয়ে উঠেছে।
মার্কিন ডলার শক্তিশালী হওয়ার পরেও স্বর্ণের উত্থান সেই পরিবর্তনকে আরও দৃঢ় করে। মুদ্রা গতিশীলতা কেন্দ্রীয় ব্যাংকের নীতির আধিপত্য দ্বারা ছাপিয়ে যাচ্ছে বিশ্বব্যাপী সম্পদ মূল্যায়নে।
স্বর্ণের চাহিদা উত্থানে গভীরতা যোগ করে
জল্পনামূলক কাহিনীর বাইরে, স্বর্ণের উত্থানে শক্তিশালী বাস্তব জগতের সমর্থন রয়েছে। শারীরিক চাহিদা বিশেষ করে ভারত এবং কেন্দ্রীয় ব্যাংকগুলির মধ্যে দৃঢ়:
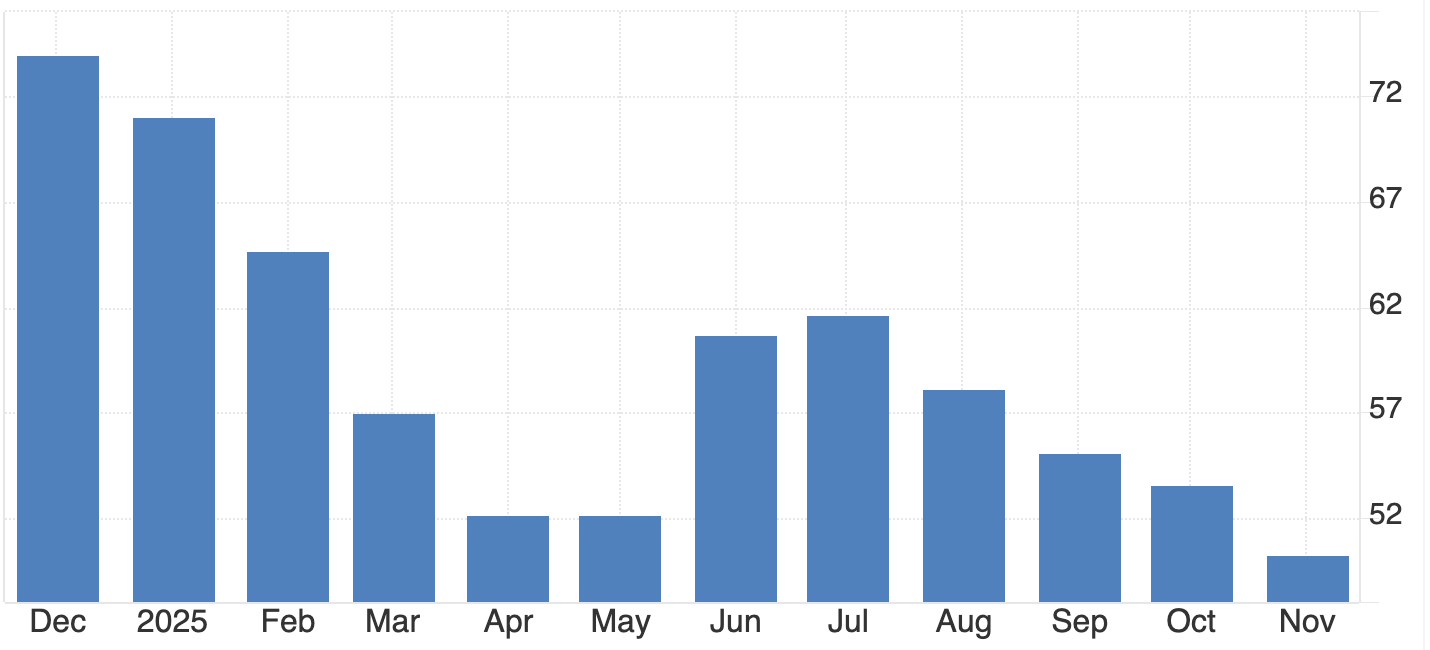
- ভারতের স্বর্ণ ETF প্রবাহ ২০২৫ সালের প্রথম ১০ মাসে $২.৯ বিলিয়ন পৌঁছেছে - যা ২৬ টন স্বর্ণের সমান, যা ২০২০ থেকে ২০২৪ সালের মোটের প্রায় সমান।
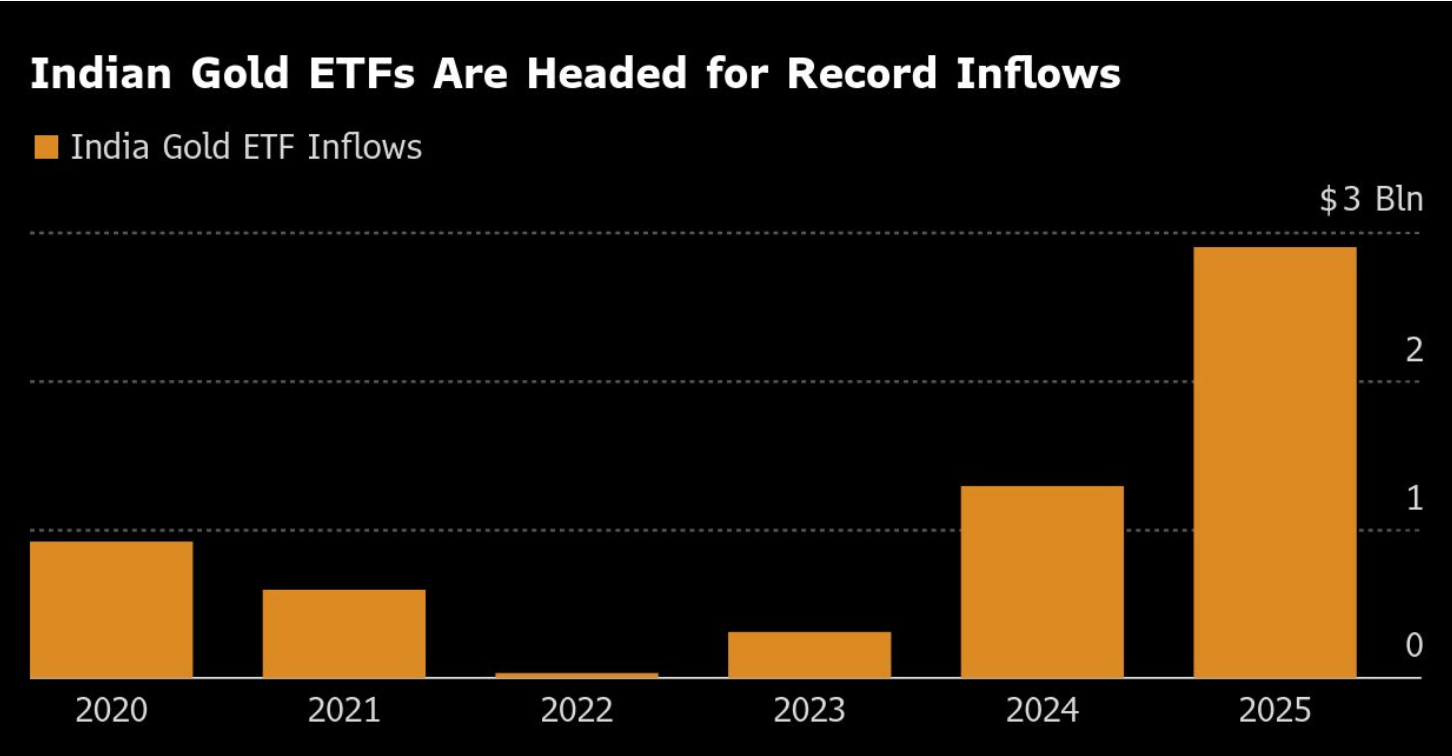
- শুধুমাত্র অক্টোবর মাসে $৮৫০ মিলিয়ন নতুন প্রবাহ দেখা গেছে, সেপ্টেম্বরের রেকর্ড $৯৪২ মিলিয়নের পর।
- ভারতের মোট ETF হোল্ডিং এখন ৮৩.৫ টন, যার মূল্য $১১ বিলিয়নেরও বেশি।
এই চাহিদা নির্দেশ করে যে উত্থান শুধুমাত্র জল্পনামূলক নয়। এটি একটি দীর্ঘমেয়াদী মূল্য সংরক্ষণের জন্য স্বর্ণের প্রকৃত বৈশ্বিক আকাঙ্ক্ষাকে প্রতিফলিত করে - মুদ্রানীতি এবং আর্থিক অনিশ্চয়তার বিরুদ্ধে একটি প্রতিরোধ।
স্বর্ণ খনিরা বিনিয়োগকারীর আস্থা প্রতিফলিত করে
স্বর্ণ বাজারের কর্পোরেট দিক এই মনোভাবের প্রতিধ্বনি। Barrick Gold (ABX.TO), বিশ্বের অন্যতম বৃহত্তম উৎপাদক, তার ত্রৈমাসিক লভ্যাংশ ২৫% বৃদ্ধি করেছে এবং $৫০০ মিলিয়ন শেয়ার বাইব্যাক প্রোগ্রাম সম্প্রসারিত করেছে একটি সংশোধিত লাভের রিপোর্টের পর।
- গড় বাস্তবায়িত স্বর্ণের দাম: প্রতি আউন্স $৩,৪৫৭, যা এক বছর আগে $২,৪৯৪ থেকে বৃদ্ধি পেয়েছে।
- উৎপাদন ৯৪৩,০০০ থেকে কমে ৮২৯,০০০ আউন্সে নেমেছে, যখন সব-ইন টেকসই খরচ সামান্য বৃদ্ধি পেয়ে $১,৫৩৮ প্রতি আউন্স হয়েছে।
অপারেশনাল চ্যালেঞ্জ এবং মালির খনি হারানোর সাথে সম্পর্কিত $১ বিলিয়ন লিখে ফেলার পরেও, Barrick-এর উত্তর আমেরিকান উৎপাদনের প্রতি কৌশলগত ঝোঁক স্বর্ণের উচ্চ মূল্যের স্থায়িত্বে আস্থা প্রকাশ করে।
তবে, মালি বিরোধ - যার মধ্যে কর্মচারীদের আটক এবং রপ্তানি নিষেধাজ্ঞা অন্তর্ভুক্ত - বৈশ্বিক স্বর্ণ সরবরাহের ভূ-রাজনৈতিক দুর্বলতাকে তুলে ধরে, যা সমাধান না হলে বাজারকে আরও সংকীর্ণ করতে পারে।
বাজার পটভূমি: ঋণ, yields, এবং নীতি বিরোধ
স্বর্ণের এই বছরের ৫০% এর বেশি বৃদ্ধি শুধুমাত্র মুদ্রাস্ফীতির ভয়ের প্রতিফলন নয়। এটি আর্থিক দুর্বলতা এবং বাজারের তরলতা নির্ভরতার প্রতিক্রিয়া।
বাড়তে থাকা Treasury yields অর্থনৈতিক সুস্থতার চেয়ে ঋণ টেকসইতা সম্পর্কে সতর্কবার্তা। বিনিয়োগকারীরা এই কাঠামোগত ঝুঁকির বিরুদ্ধে হেজ হিসেবে স্বর্ণ কিনছেন, একই সময়ে তারা ধরে নিচ্ছেন যে liquidity প্রবাহ অব্যাহত থাকবে বলে ইক্যুইটিতে দর বাড়াচ্ছেন।
এই দ্বৈত আচরণ - নিরাপত্তা এবং ঝুঁকি একসাথে খোঁজা - ২০২৫ সালের বাজার মনস্তত্ত্বের সংজ্ঞায়িত বিরোধ।
স্বর্ণ এবং মার্কিন স্টকের সামনের মাসগুলোর সম্ভাব্য দৃশ্য
- বুলিশ ব্রেকআউট
যদি Fed ডিসেম্বর মাসে রেট কমায় এবং আরও শিথিলতার ইঙ্গিত দেয়, তাহলে স্বর্ণ দ্রুত $৪,২০০ ছাড়িয়ে যেতে পারে, আর্থিক উদ্বেগ এবং কেন্দ্রীয় ব্যাংকের স্থির চাহিদার সমর্থনে।
- স্বল্পমেয়াদী সংহতি
সাবধানী বা বিলম্বিত Fed অবস্থান স্বর্ণকে $৪,০৫০ থেকে $৪,১৫০ এর মধ্যে স্থিতিশীল রাখতে পারে, ইক্যুইটি সম্ভবত লাভ বজায় রাখবে যতক্ষণ না তরলতা প্রত্যাশা কমে।
যাই হোক, মূল বিষয় হল যে স্বর্ণ এবং স্টক এখন একই ম্যাক্রোইকোনমিক চালকের প্রতি সাড়া দিচ্ছে - অর্থের মূল্য - বিপরীত আবেগের নয়।
স্বর্ণের প্রযুক্তিগত অন্তর্দৃষ্টি
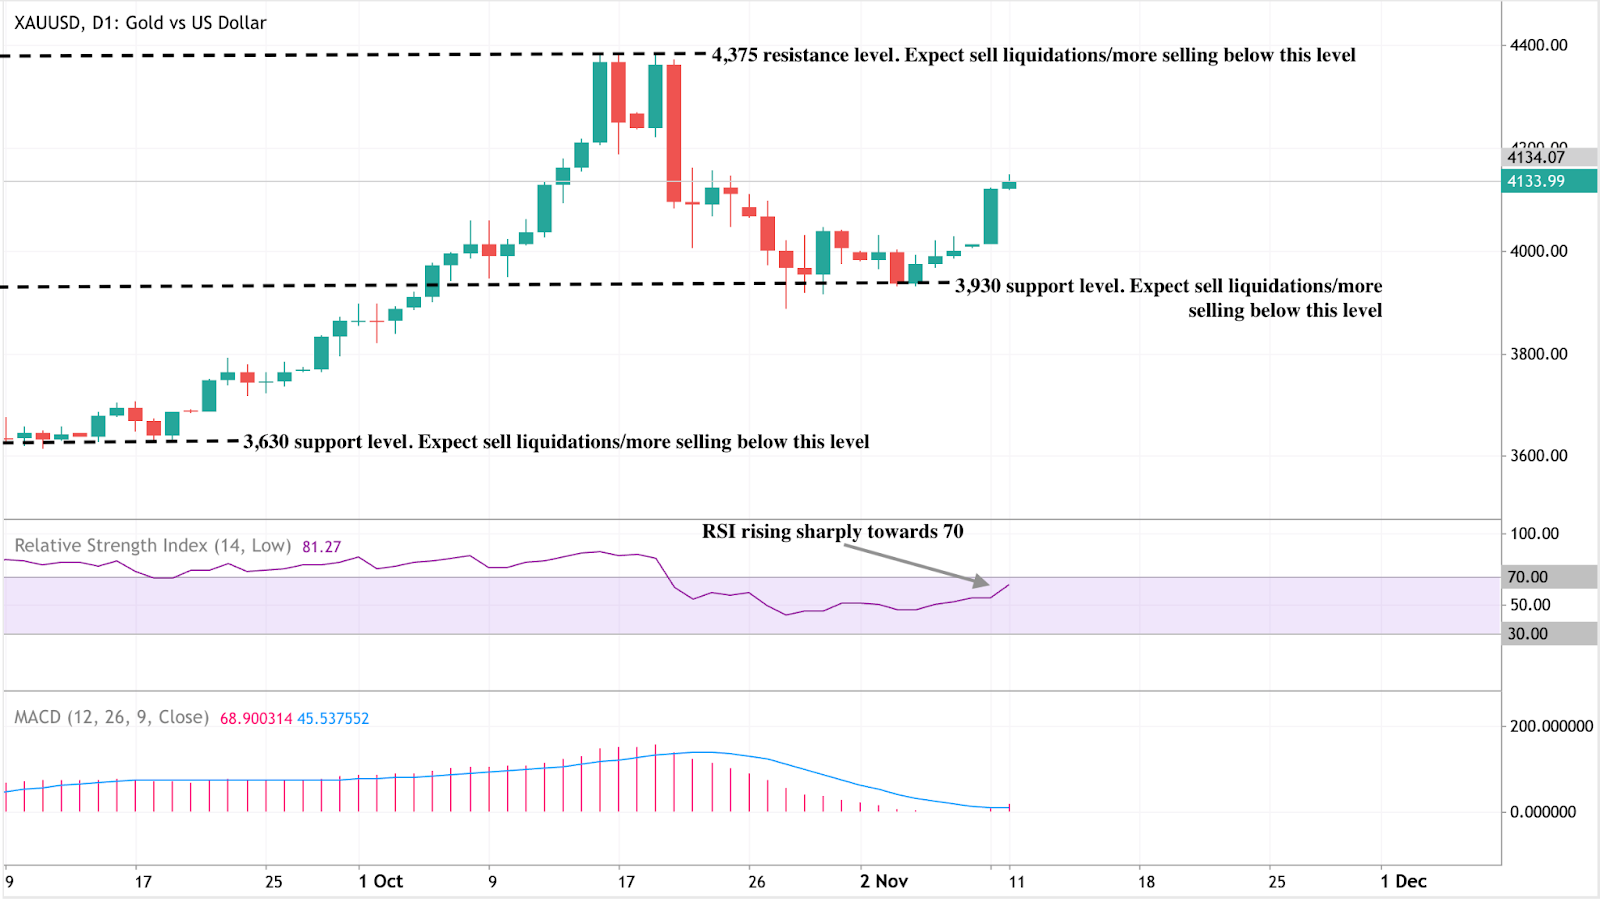
স্বর্ণ (XAU/USD) প্রায় $৪,১৩৪ এ লেনদেন হচ্ছে, মূল স্তরের মধ্যে সংহত হচ্ছে - প্রতিরোধ $৪,৩৭৫ এবং সমর্থন $৩,৯৩০। $৪,৩৭৫ এর উপরে ব্রেকআউট উত্থান বাড়াতে পারে, যখন $৩,৯৩০ এর নিচে পতন $৩,৬৩০ এর দিকে পুনরায় বিক্রির ঝুঁকি তৈরি করে।
RSI (৮১) শক্তিশালী বুলিশ গতি নির্দেশ করে কিন্তু অতিরিক্ত ক্রয় অবস্থার সংকেত দেয়, যা স্বল্পমেয়াদী সংহতি বা প্রত্যাহারের সম্ভাবনা নির্দেশ করে। এদিকে, MACD একটি বুলিশ ক্রসওভার বজায় রেখেছে, চলমান ক্রয় চাপ নিশ্চিত করছে।
মোটের উপর, স্বর্ণের প্রবণতা $৩,৯৩০ এর উপরে ইতিবাচক থাকে, তবে ট্রেডারদের অতিরিক্ত ক্রয় অঞ্চলের কাছে গতি শীতল হওয়ার জন্য সতর্ক থাকতে হবে। আপনি সরাসরি Deriv MT5-এ এই স্তরগুলি পর্যবেক্ষণ করতে পারেন অথবা Deriv Trading Calculator ব্যবহার করে ধাতু এবং সূচকের জন্য মার্জিন এবং ঝুঁকি সেটআপ পরীক্ষা করতে পারেন।
স্বর্ণ বিনিয়োগের দৃষ্টিভঙ্গি
- স্বল্পমেয়াদী ট্রেডার: Fed-এর ডিসেম্বর সিদ্ধান্তের আগে $৪,১০০–$৪,২০০ অঞ্চলটি নজরদারির মূল ক্ষেত্র।
- মধ্যমেয়াদী বিনিয়োগকারী: আর্থিক চাপ, বাস্তব রিটার্নের অস্থিরতা, এবং ভারতীয় চাহিদা অব্যাহত শক্তির মূল চালক।
পোর্টফোলিও ম্যানেজার: স্বর্ণের ইক্যুইটির সাথে পরিবর্তিত সম্পর্কের অর্থ এটি এখন একটি নীতি-সংবেদনশীল সমান্তরাল সম্পদ হিসেবে কাজ করে, একটি নিখুঁত হেজ নয়। বৈচিত্র্যকরণ কৌশলগুলিতে এই কাঠামোগত পরিবর্তন বিবেচনায় নেওয়া উচিত।
উল্লেখিত পারফরম্যান্সের সংখ্যা ভবিষ্যতের পারফরম্যান্সের গ্যারান্টি নয়।


